Threat Response - Integration with Tanium
The Tanium Endpoint Platform is an endpoint security and systems management platform that enables administrators to quickly execute network-wide queries to retrieve information about systems running on a network. Threat Response is designed to interface with the Tanium platform to facilitate data collection as part of the incident response process. By utilizing Tanium’s ability to deploy and execute sensors on an endpoint, Threat Response administrators can tailor data collection in Threat Response to meet analyst’s needs.
Deploying Proofpoint Client Monitor
The Proofpoint Client Monitor is a persistent endpoint agent that can be deployed via Tanium. The agent monitors the endpoint’s registry looking for suspicious activity in various Run Key locations, commonly used to start an application on system boot. When a change is detected pointing back to a local file, the Proofpoint Client Monitor will immediately take a snapshot of the system, and generate an alert to Threat Response.
Functions of the Proofpoint Client Monitor
The Proofpoint Client Monitor serves as a way for Threat Response to interface with endpoints via Tanium. Functions of the Proofpoint Client Monitor are outlined below.
Registry Monitoring
The Proofpoint Client Monitor can be deployed onto your endpoints to monitor for suspicious changes in the registry.
Malicious software will often attempt to insert a reference to itself into the registry to ensure that it is executed whenever the system starts up. By monitoring common Run keys in the registry, the Proofpoint Client Monitor can quickly detect when a new registry value is created that points at a potential executable on the endpoint. When such a change is detected, the Proofpoint Client Monitor will take a snapshot of the current system state, and generate an alert to Threat Response.
Monitoring the registry is proven to be an effective measure in quickly identifying suspicious activity as it occurs in the registry. Quicker identification translates to a system snapshot that runs in parallel with malware execution, improving Threat Response’s ability to capture transient malware indicators, such as network connections and mutexes, while they are active on the endpoint.
PC Data Collection
In addition to registry monitoring, the Proofpoint Client Monitor also serves as a persistent agent that can execute PC Data Collections on behalf of Tanium. Executing PC Data Collections via Tanium is useful in environments where Threat Response does not have direct access to the endpoints, or where the ADMIN$ share is disabled on those systems.
Preparing the Proofpoint Client Monitor
In order to communicate events back to Threat Response, the Proofpoint Client Monitor must be configured with the location of Threat Response. While configuring the agent, changes can also be made to the list of monitored registry keys, as well as exceptions to the monitoring service.
The following sections describe each step in this configuration process.
Basic Configuration
Prior to deployment, the Proofpoint Client Monitor must be configured with the location of Threat Response.
To upload the Proofpoint Client Monitor to Tanium:
- Log in to Threat Response.
- Navigate to the
Sourcespage. - Create a new
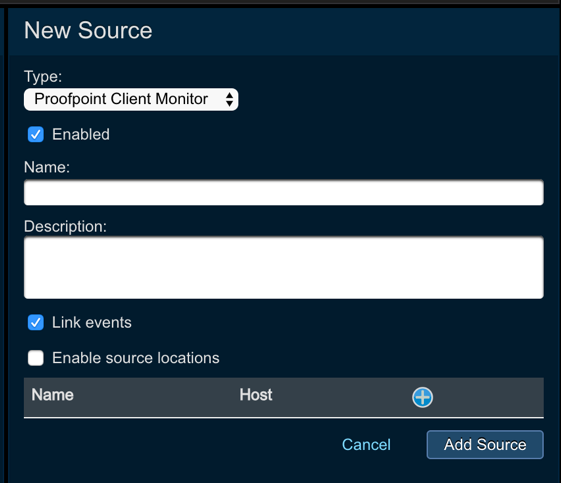
Sourcewith a type:Proofpoint Client Monitor. ProvideNameandDescriptionand allow Threat Response to automatically link the events into incidents by checking the Link events checkbox.

- In the
Source Detailspanel, copy thePOST URLfor the new source. - Download the Proofpoint Client Monitor from the Proofpoint Support portal, and unpack it to your desktop.
- Create a new folder called:
Package - Copy the following files and folders into the Package folder:
- EventExclusion.config
- Proofpoint_Client_Monitor.config
- Proofpoint_Client_Monitor.exe
- Version.txt
- custom_scripts
- registry.txt
- snapshots
- standard_scripts
- x64
- Edit the Proofpoint_Client_Monitor.config file, and change the following:
bridge_url = <alert_source_post_url>- Save changes.
With the Bridge URL configured, the Proofpoint Client Monitor can now communicate with Threat Response. The following sections describe configuration options for registry monitoring.
Defining Registry Keys to Monitor
By default, the Proofpoint Client Monitor is configured to monitor common Run keys on a Windows system. Keys can be added or removed from the monitor list by editing the registry.txt file.
To edit the file:
- Using Notepad, open the
registry.txtfile in the Package folder created earlier. - Add or remove registry keys to monitor as needed. Each key is listed one-per-line.
- Save changes.
Threat Response will recursively monitor all keys added to this file. Any key that is specified will also have its child keys monitored by the Proofpoint Client Monitor.
Configuring Exclusions
Exclusions can be created to ignore changes to specific keys or specific key values that are created. This can be useful in minimizing unwanted alerts generated as the result of common, benign changes, such as regularly scheduled software updates.
To configure exclusions:
- Using Notepad, open the
EventExclusion.configfile in the Package folder created earlier. - Update the
ExclusionCountin the file to reflect the number of exclusions that will be defined. - Create your exclusion by defining the pattern number, registry key, and the pattern to ignore on a single line. The
<key>should be replaced with the full registry key that should be ignored. The<pattern>is a string value that will be compared to the registry value. Wildcards are not supported. - Save Changes.
PatternN=<key>,<pattern>Note
The pattern numbers begin with zero (0). Each pattern must be named Pattern0 … PatternN-1, where N is the ExclusionCount.
When exclusions are configured, Threat Response will ignore any value/data pairs that matching the defined pattern, that are created in, or below, the defined registry key. Note that exclusions are applied recursively, so they will be applied to any children keys of the key you specify.
Below are the contents of the default exclusion file included in the Tanium package. There are two exclusions created by default, both of which tell the Proofpoint Client Monitor to ignore registry values pointing at rollback scripts. These rollback scripts are commonly used during software updates on Windows systems.
Default Exclusion File:
ExclusionCount=2

# Exclude all files with an extension of "rbs" under
# HKLM\System\CurrentControlSet\Control\Session and its children
Pattern0=HKLM\System\CurrentControlSet\Control\Session Manager,rbs

# Exclude all files with an extension of "rbf" or "rbs" under
# HKCU\Software\Microsoft\Windows\CurrentVersion\Uninstall and its children
Pattern1=HKCU\Software\Microsoft\Windows\CurrentVersion\Uninstall,rbf,rbs
Packaging the Proofpoint Client Monitor as a ZIP File
Prior to uploading the Proofpoint Client Monitor to Tanium, you will need to package the files as a ZIP archive.
To create the Proofpoint Client Monitor ZIP:
- Navigate into the Package folder created earlier.
- Select all files and folders, and package them as a ZIP file named:
Proofpoint Client Monitor.zip
Note
When creating the ZIP file, you may get a warning that some of the folders have no contents. This is normal, and you should proceed with creating the ZIP file. The Proofpoint Client Monitor will create these folders as needed.
Uploading to Tanium
Threat Response packages are available for Tanium, allowing you to deploy and manage the Proofpoint Client Monitor through the Tanium console.
To upload the Proofpoint Client Monitor to Tanium:
- Log in to the Tanium web interface as an administrator.
- Navigate to
Authoring>Packages. - Click the I
mport Contentbutton, and select theTR.xmlfile. - For each of the imported Proofpoint packages, perform the following:
- Click the
Editlink to open the package configuration. - For each of the files listed in the package, delete, and replace those files with the files with the files unpacked in step 5.
- Click
Save Changesto save the package.
- Click the
After completing the steps above, the Proofpoint Client Monitor packages are now uploaded to Tanium, and ready to be pushed out to your endpoints.
Deploying to Endpoints via Tanium
With the packages uploaded to Tanium, you can use Tanium’s Deploy Action function to push a copy of the Proofpoint Client Monitor to target machines.
To deploy the Proofpoint Client Monitor using Tanium:
- Log in to Tanium as an administrator.
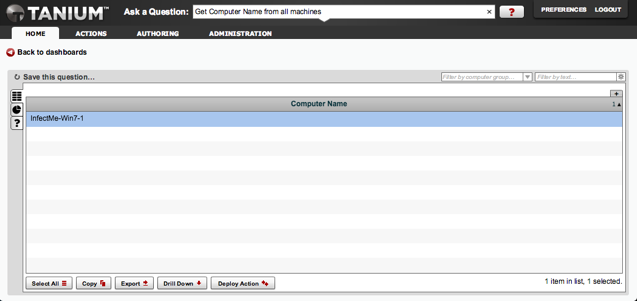
- Use the Ask a Question function to locate target machines for the Proofpoint Client Monitor.

- Select the machine(s) from the results that you want to receive the package, then click
Deploy Action. - Select the package for deployment: Proofpoint Threat Response – Install Proofpoint Client Monitor
- Confirm your target machines, and then click
Finish.
Tanium will begin deploying the Proofpoint Client Monitor to the machines that you have selected as targets. Upon completion, the Proofpoint Client Monitor service will run on the endpoints. The other packages imported in the previous section enable you to uninstall or restart the Proofpoint Client Monitor using this same Deploy Action mechanism.
Querying Tanium Sensors
Threat Response’s ability to retrieve endpoint information via Tanium lies in its ability to query sensors available on the Tanium server. Each sensor in Tanium is designed for a specific purpose, such as gathering process info, or pulling the browser history from an endpoint; administrators can even build their own sensors to customize the information that is collected.
This chapter covers the configuration of Threat Response to query sensors in Tanium, as well as how to execute a query from within an incident.
Preparing Threat Response
Prior to running queries in Threat Response, you must tell Threat Response where the Tanium server is located, and define which sensors will be available in Threat Response.
To configure a Tanium Server in Threat Response:
- Log in to Threat Response.
- Navigate to the
System Settings>Tanium page. - Click the blue plus
“+”icon in theTanium Serverssection to link Threat Response to a new Tanium server. - In the New Tanium Server panel, input the
IP/Hostnameof the Tanium server, and provide credentials that Threat Response can use to execute queries. - Save changes.
Note
The credentials provided must have Action User level privileges in Tanium to execute Tanium queries.
With the Tanium server configured, you will now see a Tanium tab in the incident view. You can adjust the sensors that are displayed in this tab by adding or removing sensors from the Tanium Sensors table in the Tanium settings page.
To add a new sensor:
- Click the blue plus
“+”icon in the Tanium Sensors section - Input the
nameof the sensor as defined in Tanium. Savechanges.
By default, the Tanium Sensors table includes the following sensors:
| Tanium Sensor | Description |
|---|---|
| Browser History | Returns browser history for all users, works only for IE versions 5 through 9. |
| Running Applications | Provides a list of applications that are running at the present time on the client machine. |
| Running Processes | Provides a list of processes currently running on the client machine. |
| Running Service | Provides a list of currently running services on the client machine. |
| IP Address | Current IP Addresses of client machine. |
| IP Connections | Returns the protocol, local address / port, process name, application name, remote port, and connection state for all active IP connections on an endpoint. |
| Listen Ports | Returns information network-aware processes and the ports they have bound to. |
| Startup Programs | A list of programs configured to automatically run on the client machine. Also includes the command line entry to run the program. |
Querying Sensors from an Incident
With your Tanium server and sensors configured, you can begin executing Tanium queries from within your incidents.
To query a Tanium Sensor:
- Navigate to an incident in Threat Response.
- Click on the Tanium tab.
- Click the Query Tanium button to start the query.

Threat Response will connect to the Tanium API, and issue a question for the sensor that you have selected.
Once the query is complete, and data has been returned to Threat Response, it will be displayed in the sensor tab. To refresh this data, a new query can be executed, which will overwrite the existing data.
Note
Tanium query results are cached for 10 minutes, and then cleaned up from the system.
Executing PC Data Collection
The Proofpoint Threat Response PC Data Collection can be executed via Tanium as an alternative to the native collection model that relies on connecting to the ADMIN$ share. To perform a collection via Tanium, you must have the Proofpoint Client Monitor installed.
There are numerous benefits to executing a collection via Tanium that may apply to more restrictive networks:
- Access to the ADMIN$ share is no longer required
- Windows RPC is no longer required to the endpoint
- Endpoint administrative rights are no longer required for Threat Response
This chapter will cover the requirements, and steps to prepare Threat Response, Tanium, and the endpoints for this action.
Preparing for PC Data Collection
To prepare your network for executing PC Data Collections via Tanium, you will need to make changes to Threat Response, Tanium, and the endpoints. Below is a brief summary of the steps and what is required:
- A Tanium Server must be defined in Threat Response
- Threat Response collection method must be updated to use Tanium
- The Threat Response collector package must be uploaded to Tanium
- The endpoints must be running the Proofpoint Client Monitor agent
Each of these items is described in more detail in the following sections.
Defining a Tanium Server in Threat Response
A Tanium Server must be defined in Threat Response prior to executing a collection via Tanium. This tells Threat Response how to reach Tanium, and defines the credentials used to execute the collection.
To configure a Tanium Server in Threat Response:
- Log in to Threat Response.
- Navigate to the
System Settings>Taniumpage. - Click the blue plus
“+”icon in theTanium Serverssection to link Threat Response to a new Tanium server. - In the New Tanium Server panel, input the IP/Hostname of the Tanium server, and provide credentials that Threat Response can use to execute queries.
- Save changes.
Note
The credentials provided must have at least Action Author privileges in Tanium to execute Tanium queries.
Note that the Tanium permissions required to execute a PC Data Collection via Tanium are higher than what is required for a Tanium sensor query. If you have already configured a Tanium Server for sensor queries, then you will need to adjust the Tanium account used by Threat Response to have a role of Action Author.
Updating Threat Response Collection Method
By default, Threat Response is configured to use its native collection method, which involves connecting directly to the client. You will need to update this so that Threat Response knows to connect to Tanium to request a collection.
To update the collection method:
- Log in to Threat Response.
- Navigate to the
System Settings>Data Collectionpage. - In the PC Data Collection section, set the
Collection TypetoTanium. Savechanges.
Note
Executing an PC Data Collection via Tanium requires higher permissions than querying Tanium Sensors. Prior to running a collection, you may need to update the credentials used in the Tanium settings on Threat Response.
Threat Response is now configured to reach out to Tanium to perform a collection. This change will be reflected in the collection popup, as it will no longer require username and password information to execute the collection.
Deploying Proofpoint Client Monitor
The Proofpoint Client Monitor is a persistent agent that can be deployed to your endpoints via Tanium. Utilizing Tanium’s package deployment capabilities, the Proofpoint Client Monitor can be deployed to all or select endpoints in your network.
For more information on how to deploy the Proofpoint Client Monitor via Tanium, please see Deploying Proofpoint Client Monitor.
Starting a PC Data Collection
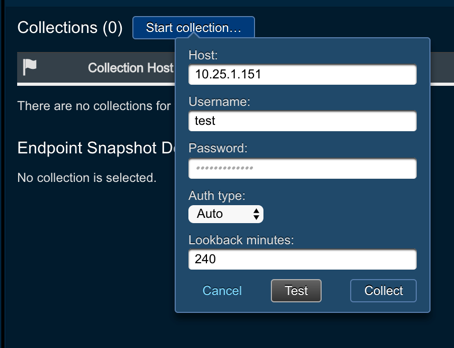
A PC Data Collection can be started from within an incident by navigating to the PC Data tab. Clicking the Start Collection button will open a popup to begin the collection.

The system will pre-populate the offending IP into the collection form. You can also define the following parameters for the collection:
- Lookback Minutes: How far to look back in the system history for changes
Press Collect to begin the collection. Upon completion of the collection, Threat Response will enable the tabs at the top of the page, and begin its data correlation routine to check the collected data against malware reports received by Threat Response.