Threat Response - User Guide
User guide provides information on how to operate Threat Response, use its features, as well as navigate the UI. You will learn how to generate responses, write match conditions, work with pop-ups and enable incident response workflows.
Note
If you need more detail on how to configure various Threat Response functionality, please, proceed with the Administration guide.
Threat Response workspace
Threat Response workspace is the web UI interface that is used to interact with the product and its functionality.
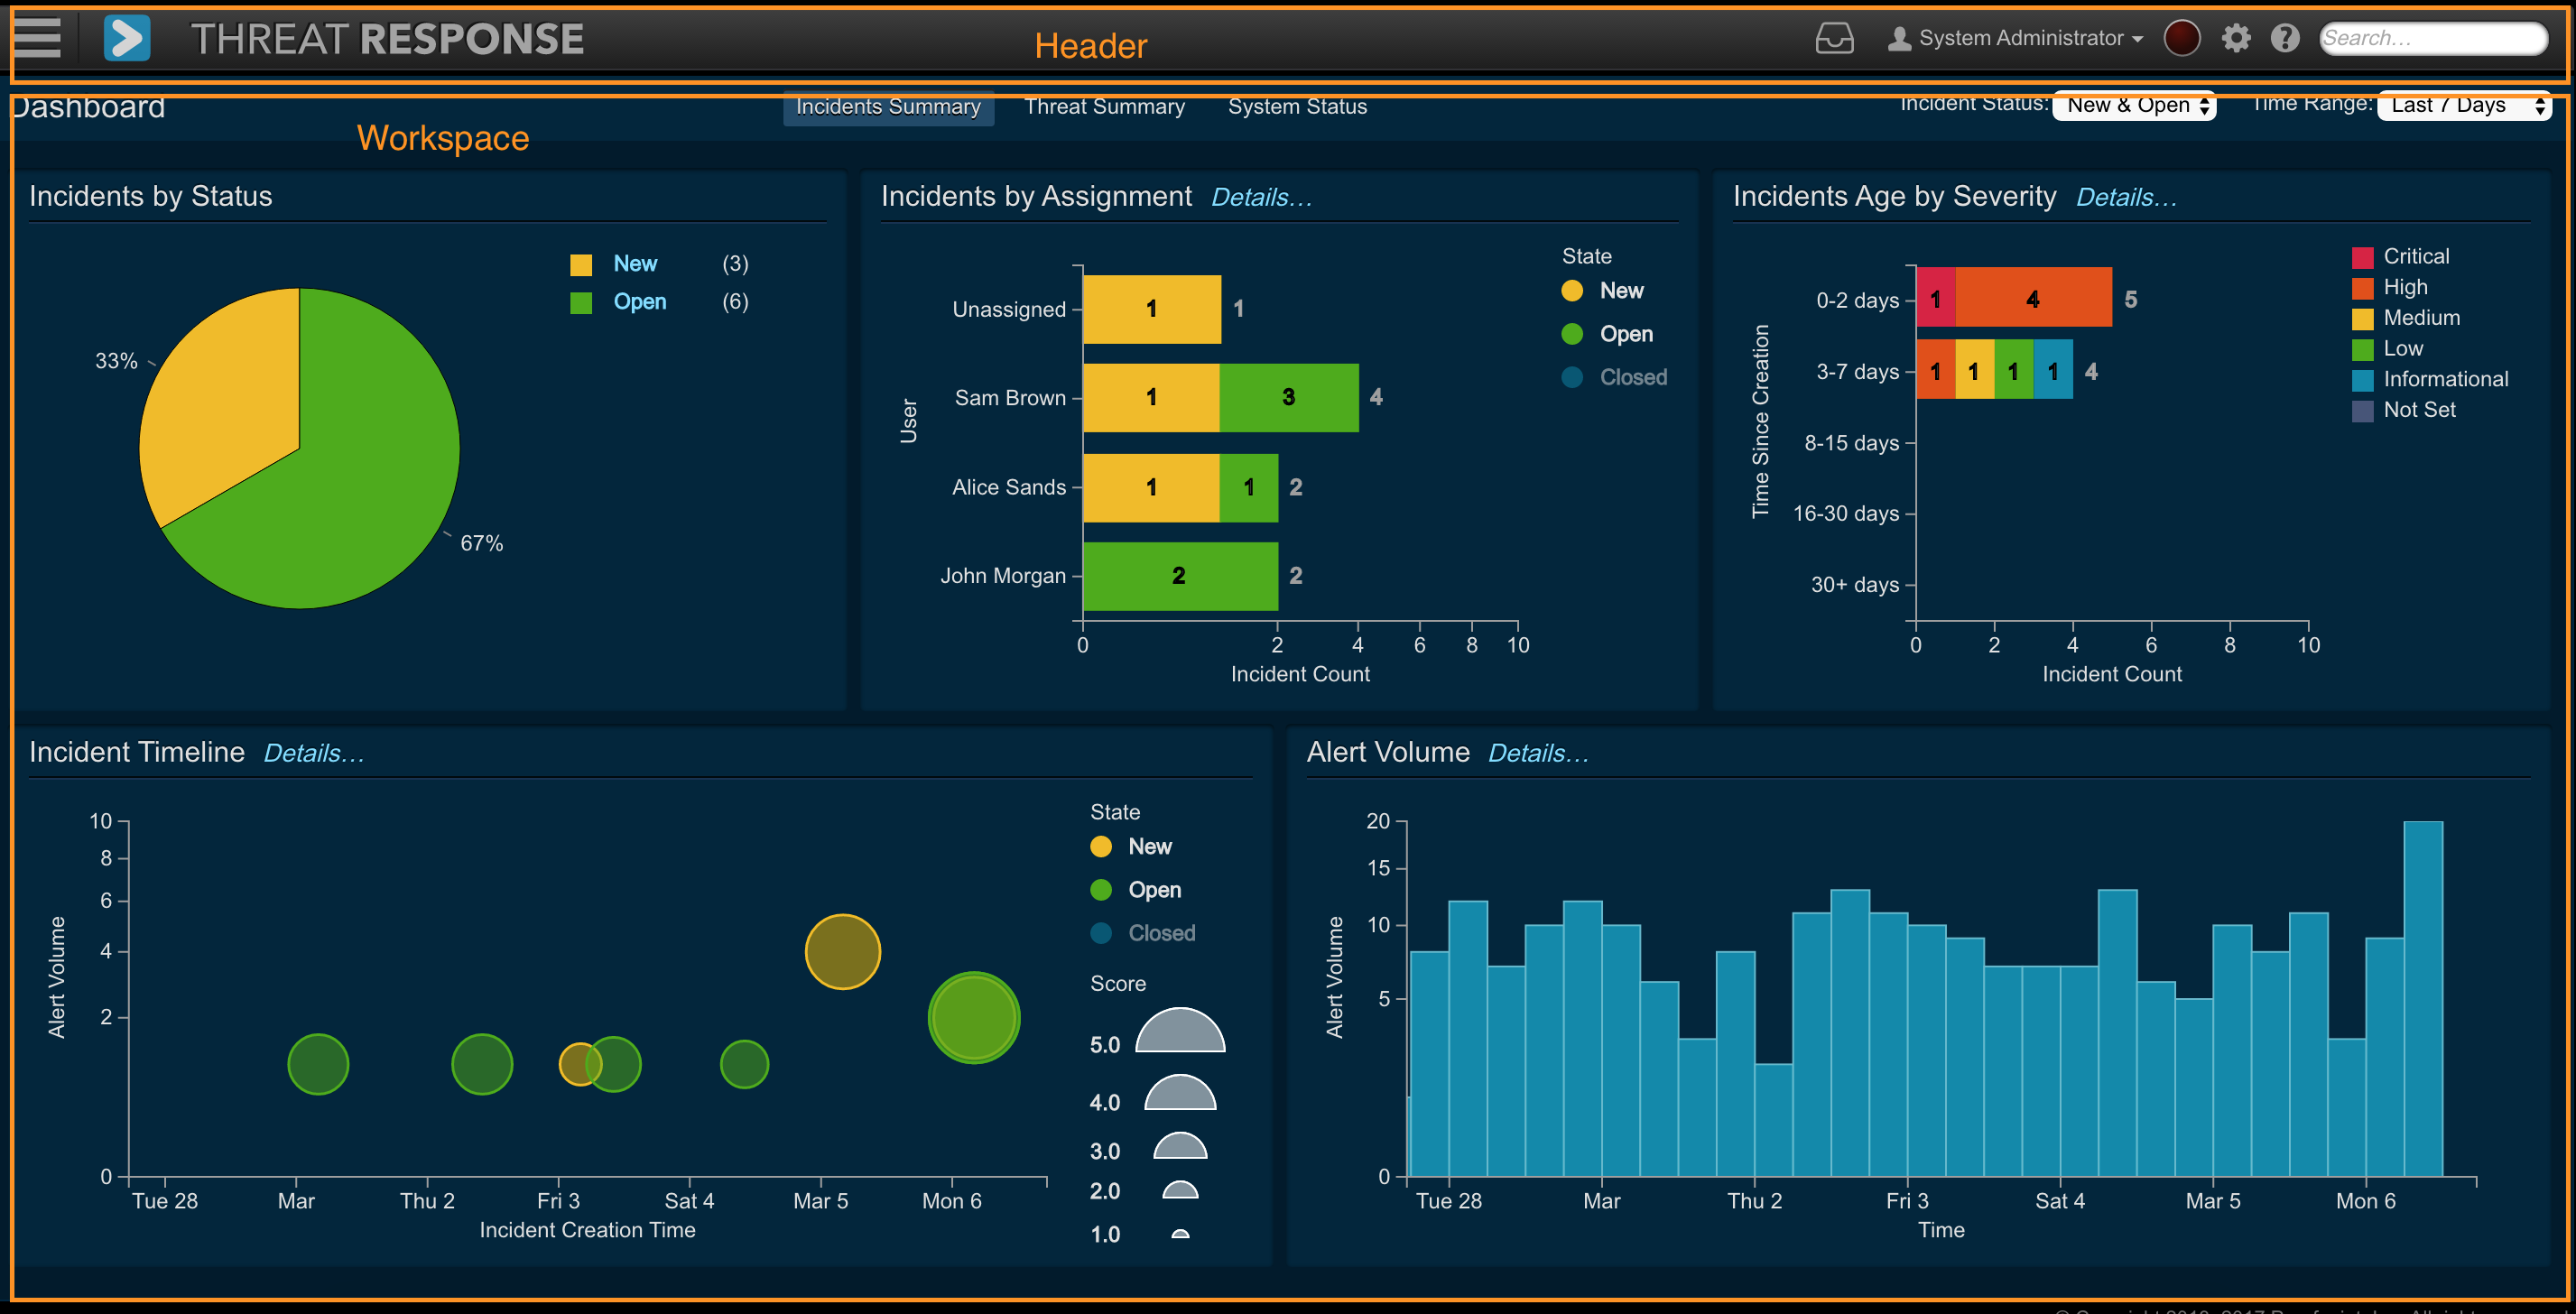
The Threat Response workspace has the following areas:
- Header: The header bar provides quick links to the navigation menu, system error and system settings, among other functions.. See the Header section in this chapter for more details.
- Workspace: This is the main workspace for each window and displays different content based on your current location in the UI. The screenshot above shows the dashboard view with its multiple panes.
Header

The header section (see detailed screenshot above) is available on all pages of Threat Response UI and provides following functionality:
- Navigation Menu: Provides a dropdown navigation menu for all Incident Response features.
- Dashboard Link: (short cut): This is short cut to get to the Dashboard views from any page in the UI.
- Notification inbox: notification inbox that shows all notifications that relate to user's incidents
- User Info: you can log out of Threat Response by clicking the username and selecting Sign Out.
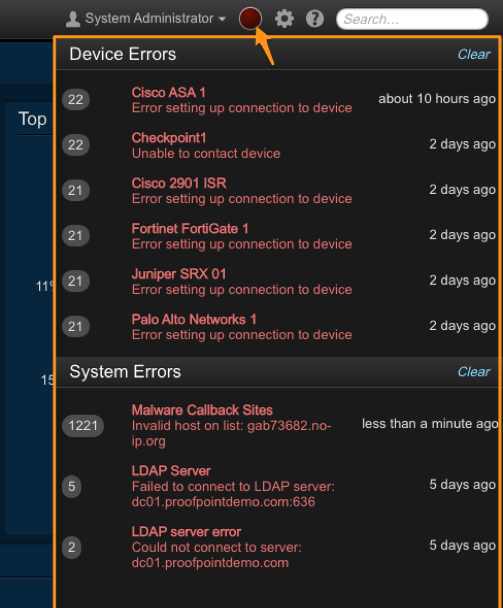
- System Error:The red error indicator glows (or pulsates) when errors are reported by the system. Click this indicator to slide open the Error Panel (see below). To clear errors, click the Clear link at the top of the panel.
- System Management: The gear menu includes the following options:
- System Settings – Navigates to the configuration settings for Threat Response.
- Manage Users–Navigates to the user management page to add, edit, or remove user accounts in Threat Response.
- Audit Activity – The Audit Activity records a Activity of all changes made in Threat Response, including (but not limited to) incident creation and management, creation of responses, settings modifications, and more.
- Help: Clicking the help button will open the online documentation
- Global Search: Search box to allow analysts and admins to search for varies types of objects including IP addresses, hostnames, file hashes, etc.
Navigation menu
Access the Navigation menu by clicking on the (hamburger) drop-down on the extreme left-hand side of the Header.

The Navigation menu allows you to navigate between top-level pages in Threat Response. This includes configuration pages, the incident view, and reporting. The Navigation menu contains the following menu items:
- Dashboard — Access three out-of-the-box dashboards (Incident Summary, Threat Summary, and System Status).
- Incidents — View and manage incidents created in Threat Response.
- Investigations - View and manage investigations that are comprised of related incidents.
- Threat Intel — View and manage Threat Intelligence collected from external sources via STIX/TAXII or manually.
- Reports — Generate statistical reports directly in Threat Response.
- Lists — Create and manage block lists in Threat Response.
- Devices — Configure and manage enforcement devices for response capabilities.
- Sources — Configure and manage event sources (detection systems).
System error
The red error indicator glows (pulsates) when errors are reported by the system. Click on this indicator to slide open the Error Panel (see below). To clear errors, click on the Clear link at the top of the panel.
Global search
Threat Response allows you to easily locate alerts and incidents that contain certain content. Using the Global Search bar at the top of the page, an administrator can type in any string and Threat Response attempts to determine the kind of object being referenced. It then searches for that object in its database.
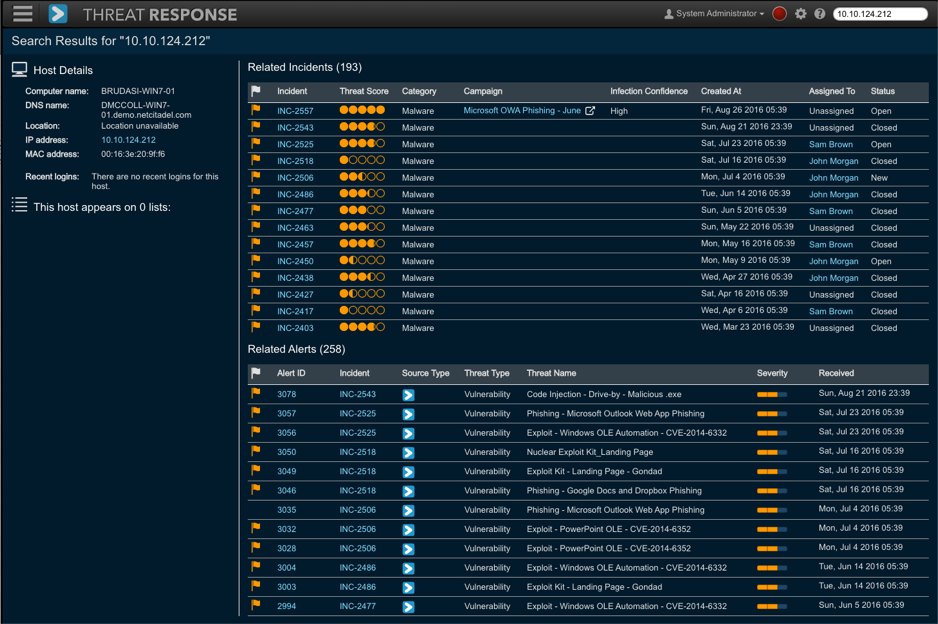
Threat Response recognizes and searches for the following objects:
- IP Address
- Hostname
- File Hash, File Name
- MAC Address
- Username
- Campaign Name
- Threat Name
- Event and Incident ID
If Threat Response does not recognize the type of object being searched for, it performs a “string-match” search throughout its database. This is especially useful when locating incidents that contain arbitrary strings, such a malware or vulnerability names that may vary between vendors.
Search results include a list of alerts and incidents in which the object appears. The results also display additional information about the object on the left-hand side of the screen to use as a quick reference. Examples of data include host details for an IP address or LDAP information for a username.
The list of all fields indexed by Threat Response for searching can be found here.
Workspace
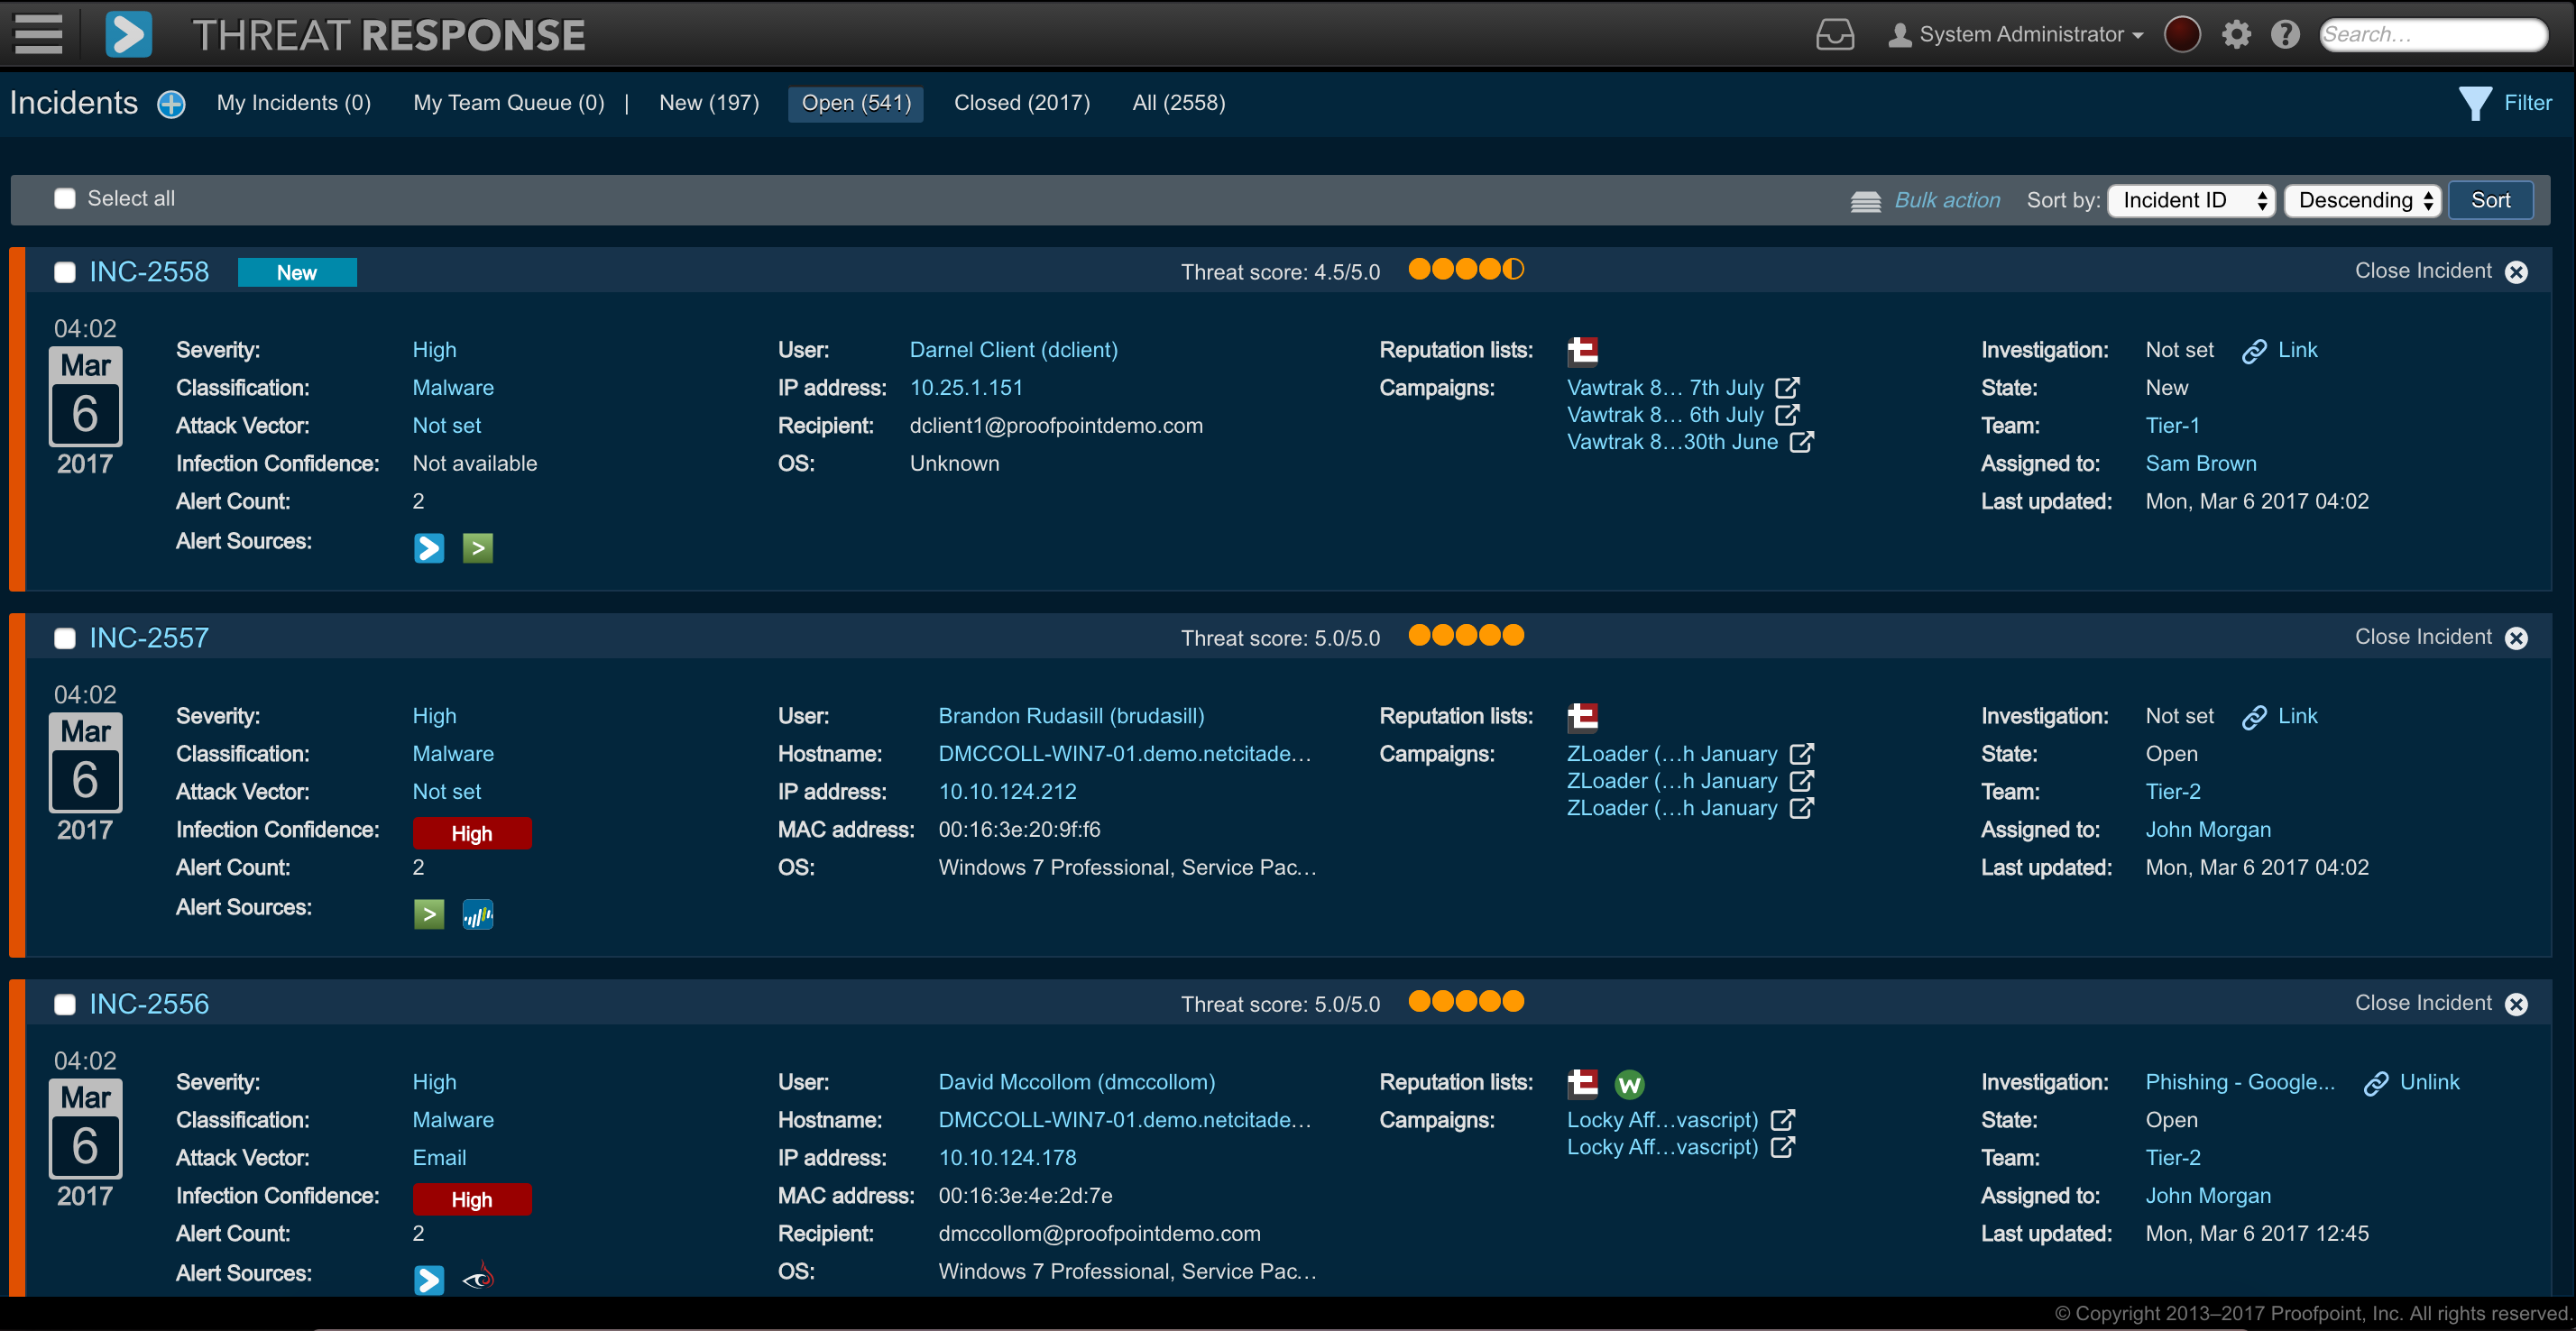
The Workspace is the main area for each window and changes depending on the menu or submenu that you select from the toolbar. The screenshot below shows the workspace for the Incident list.
Threat Response dashboard
Threat Response provides three different “out-of-the-box” dashboards:
- Incident Summary
- Threat Summary
- System Status
Note that the data presented in the Incident Summary and Threat Summary dashboards is filtered by a Time Range drop-down list on the top right-hand side. The available time ranges are:
- Last 24 Hours
- Last 7 Days
- Last 30 Days
- Last 90 Days
- Last Year
Incident Summary dashboard
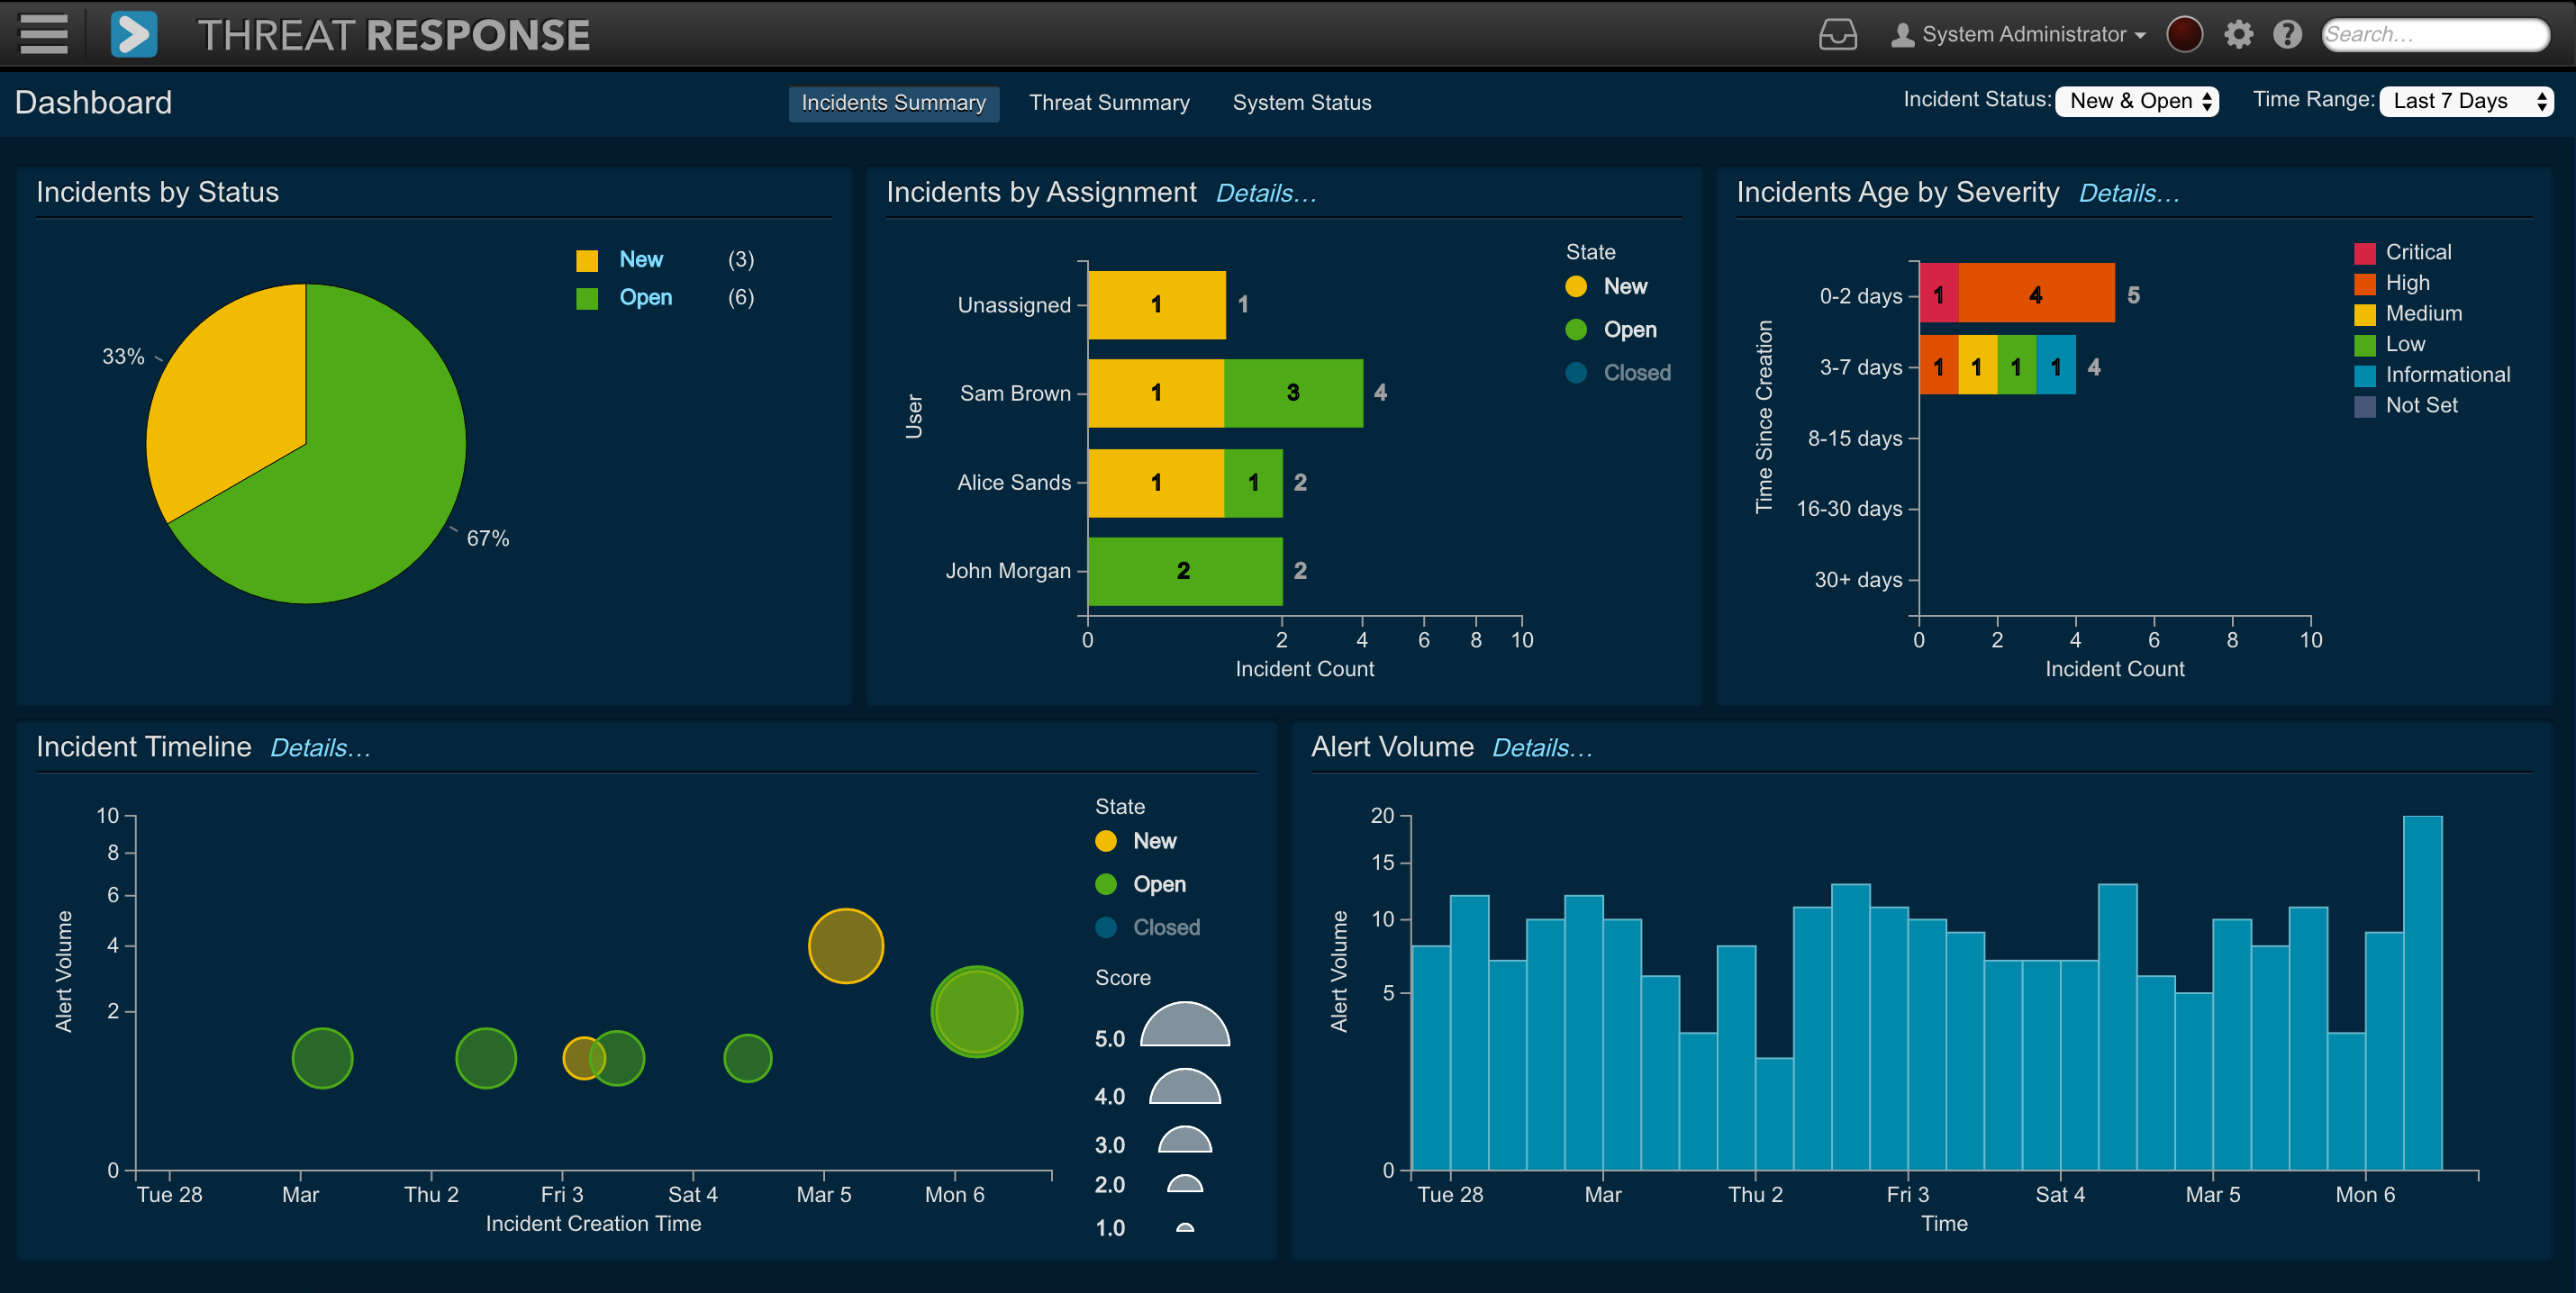
The Incident Summary dashboard provides a quick summary of all the incidents in the system. It contains the following widgets:
- Incident by Status: This is a a pie chart view of incidents by status (New, Open, Closed).
- Incident by Assignment: This is a summary of the number of incidents assigned to analysts across various states in the workflow.
- Incident Age by Severity: Incidents are grouped into age categories, and within each category Threat Response shows incidents broken down by severity.
- Incident Timeline: This is a graph that shows all the incidents within a selected timeframe. Incidents are color-coded based on their status (New, Open, Closed) and incidents with a higher Threat Score are displayed as larger bubbles in the graph.
- Alert Volume: This is the event volume graph that shows a count of all the alerts received
Threat Summary dashboard
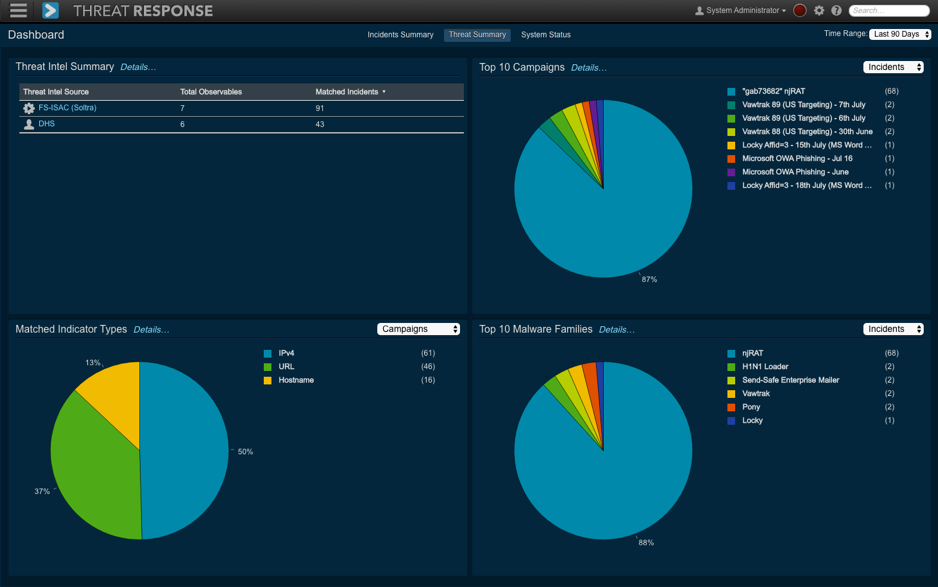
The Threat Summary dashboard provides a quick summary of all the threats linked to incidents based on Proofpoint’s Threat Intelligence (originating from Emerging Threats and Proofpoint email campaign intelligence or external threat intelligence sources, such as Hailataxii, Soltra, or any other source that supports STIX/TAXII). The Threat Summary dashboard contains the following widgets:
- Threat Intel Summary: This is a summary of the volume of observables that were collected from configured threat intelligence sources, e.g. FS-ISAC and Hailataxii versus the number of observables that were linked to an incident (see the dashboard screenshot below). This example shows that seven observables were collected from FS-ISAC (Soltra) that were linked to ninety-one incidents.
- Top 10 Campaigns: This is a summary of the top 10 Proofpoint email campaigns whose IOCs were linked to incidents or observables (threat intelligence) collected from external sources. This widget supports pivoting based on:
- Incidents: Shows the top 10 campaigns based on the number of incidents that matched Proofpoint campaign IOCs
- Threat Intelligence: Shows the top 10 campaigns based on the number of observables collected from external threat intelligence sources that matched Proofpoint campaign IOCs
- Top 10 Malware Families: This is a summary of the top 10 malware families whose IOCs were linked to incidents or observables (threat intelligence) collected from external sources. This widget supports pivoting based on:
- Incidents: Shows the top 10 malware families based on the number of incidents that matched malware IOCs found in Proofpoint’s sandbox analysis
- Threat Intelligence: Shows the top 10 malware families based on the number of observables collected from external threat intelligence sources that matched malware IOCs found in Proofpoint’s sandbox analysis
- Matched Indicator Types: This is a summary of the number of different types of observables/indicators (IP, host, URL, mutexes, etc.) that matched Campaigns or Forensic Reports across all incidents for a given time period
System Status dashboard
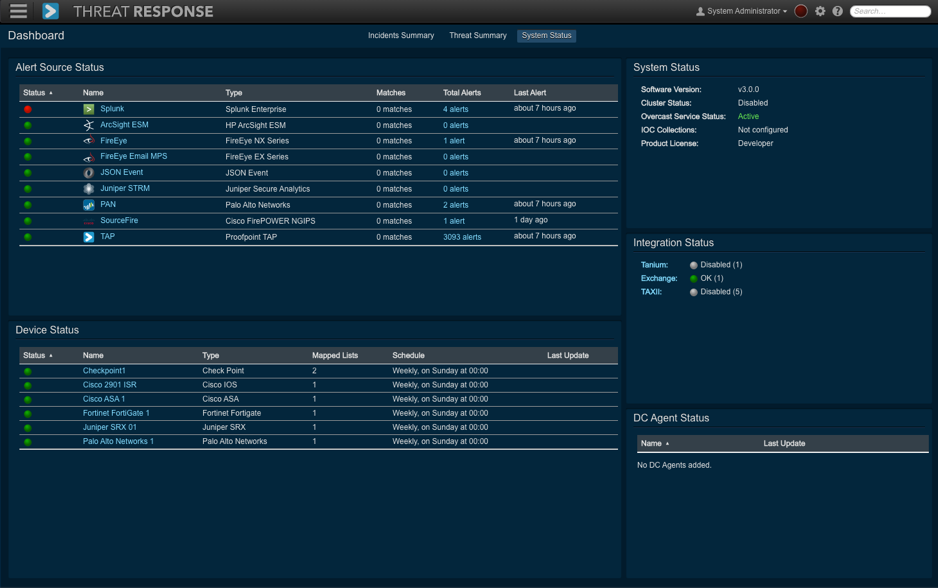
The System Status dashboard provides a quick summary of important services running on the Threat Response virtual appliance. It contains the following widgets:
- Alert Source Status: This is a list of all the configured alert sources and their status, including additional information on total alerts collected and the last time the alerts were received. You can click on the alert count for each source to get a list of the alerts that were received by Threat Response as well as debug cases for which you are not receiving an alert.
- Device Status: This is a list of all the configured devices (response automation) and their status, including additional information, such as #count of mapped lists, the last time a list was synced with a given device, and the sync schedule
- System Status: This is a summary of the general system status, including cluster status, overcast service status, and IOC collection. Note that Overcast is a cloud service used by Threat Response to query other cloud data sources, such as VirusTotal and WhoIS.
- Integration Status: This is a summary of the status of the following external integrations:
- Tanium
- Exchange
- TAXII
- DC Agent Status: This is a summary of the status of all the DC agents that have been configured. It provides the timestamp for the last time the Threat Response appliance heard back from a given DC agent. Note that the DC agent helps Threat Response to perform user-to-IP mapping by connecting to the DC and by going through the user login activity logs.
Details Pop-Ups
Throughout the interface, analysts can click on certain items to view a details pop-up with additional information. Clicking on the following will display a details pop-up:
- IP Addresses
- Hostnames
- URLs
- Usernames
- File Hashes
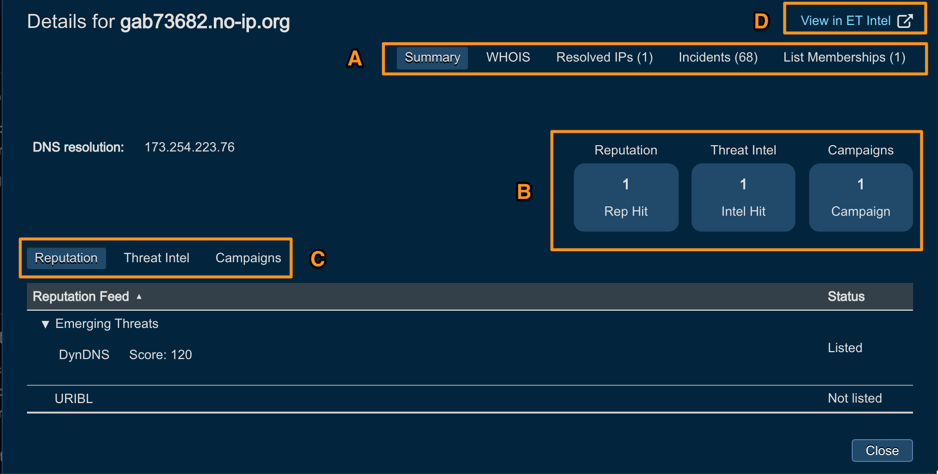
The content in the details pop-up varies based on the item. The pop-up is intended to be a quick reference for high-level details about the object, such as reputation information, recent alerts and incidents in which the object has appeared, and any lists on which the object currently resides. The following example shows the details pop-up presented when clicking on the external host “gab73682.no-ip.org.” It provides the following information (as labeled in the screenshot):
- A list of data points, including Summary, WHOIS, resolved IPs, linked incidents, and list membership
- The number of reputation, external threat intelligence, and Proofpoint campaign matches
- The tabs to see the details for each match
- Proofpoint ET Intelligence portal to be launched in context
The screenshot below shows the detailed threat intelligence for this external host in the ET Intelligence portal. It is obvious that this host was an active CNC at the time of the incident:

Note
Access to the detailed threat intelligence information requires having separate ET portal license.
Event sources
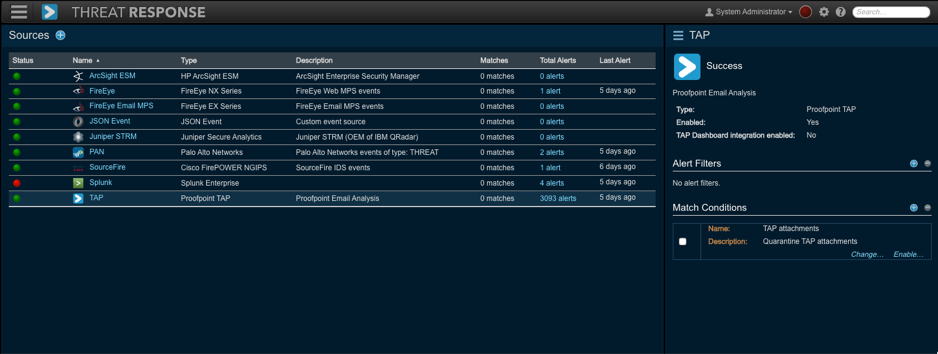
Event Sources are systems that alert Threat Response when they detect suspicious behavior on the network. Included are systems, such as Security Information and Event Management (SIEM) platforms and malware analysis platforms.
These event sources can be configured to forward alerts to Threat Response for management in the Threat Response UI. In order to read about how to configure Event sources, please, refer to the following configuration section Event sources configuration.
Lists
Lists are collections of objects, such as hostnames, URLs, and users. Such lists can be mapped to security devices where they can then be used to build security policies.
Depending on the enforcement use case, analysts who work with Threat Response, can create various lists in the system and then subsequently add items to those lists, such as adding IP address or domain to a blocklist. Then, Threat Response will synchronize lists changes with the devices that those lists are mapped to (synchronization intervals depend on the enforcement device).
In order to read about how to configure Lists, please, refer to the following configuration section Lists configuration.
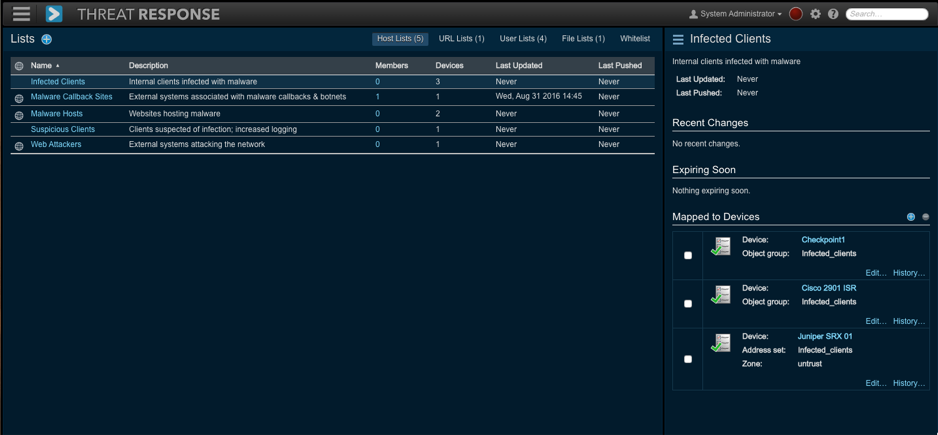
Threat Response supports the following types of lists:
- Host Lists: These are lists that contain hostnames and IP addresses that can be pushed to a firewall for use in firewall rules.
- URL Lists: These are lists that contain URLs that are intended for forward proxies.
- User Lists: These are lists that contain usernames that can be mapped to a directory server.
- Whitelist: These are IP addresses that should not be blocked.
Devices
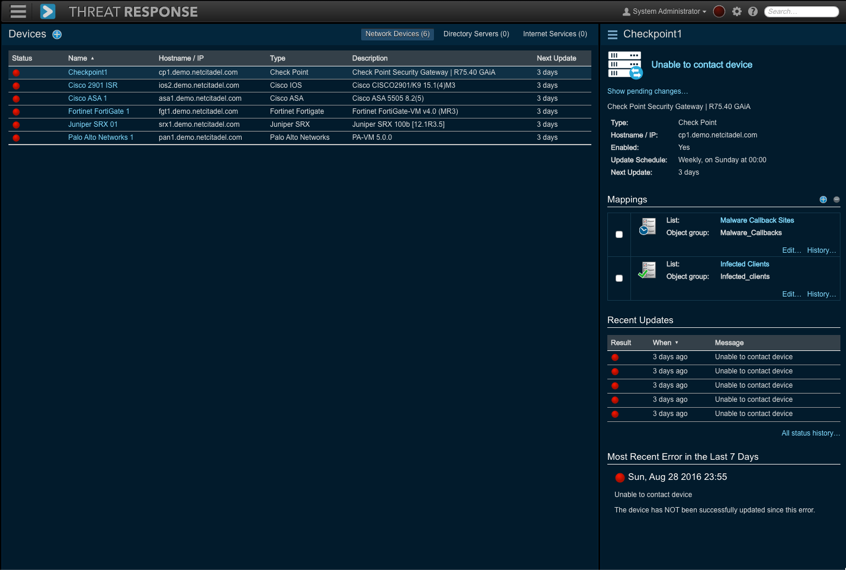
Devices are systems with which Threat Response can communicate to enforce policies enacted by analysts when creating responses in Threat Response. Devices include network equipment with ACL support, URL filtering systems, and directory servers that provide user management functionality.
In order to read about how to configure Devices, please, refer to the following configuration section Devices configuration.
Incident management
Threat Response groups security alerts that are received into “incidents.” An incident is a collection of all the information related to a security event and within Threat Response, the incident view functions as the analyst’s workspace to review individual alerts and all other information related to the security event.
Upon receipt of a new event, Threat Response looks at the information contained within and associates the event with an existing incident. If a matching incident does not yet exist, a new incident is created.
The ability to consolidate multiple alerts under a single incident provides one unified view for all activity related to a security threat and serves as an efficient way to review and manage a large volume of security alerts as they are received by Threat Response.
Reviewing the incident list
Open the Navigation menu and then select the Incidents button to open the Incidents list to manage your incidents.
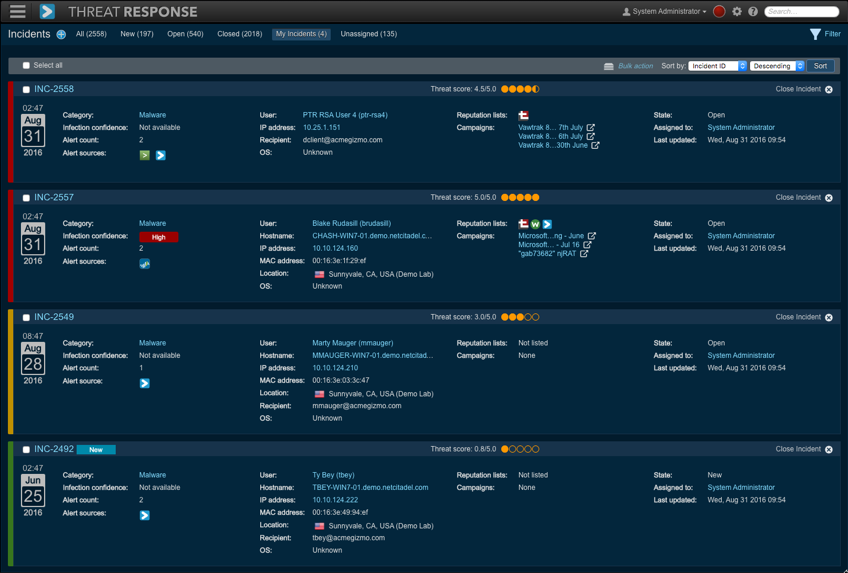
The Incidents list displays all the incidents created in Threat Response. It provides high-level details about each incident, such as specifics about the type of threat employed and the affected user. The tabs at the top of the window enable a user to filter their view to show only open or closed incidents or incidents assigned to them alone.
An analyst can sort the list by selecting a sort option from the Sort List By drop-down menu in the upper right-hand corner of the screen.
Threat scoring
A Threat Score is applied to an incident when it is created in Threat Response. The threat score is adjusted as new alerts are received and as more information is gathered about the incident. Applying a score to an incident allows administrators to quickly determine which incidents should receive immediate attention.
The following information is used to determine the final threat score:
- Event Severities
- Event Volume
- Number of Reporting Event Sources
- Reputation Hits
- Infection Confidence (for Malware-Related Incidents)
An administrator can choose to sort the Incidents list by threat score so that incidents with a high priority are displayed at the top of the list.
Manual incident creation
Threat Response creates incidents automatically upon receiving new security alerts.
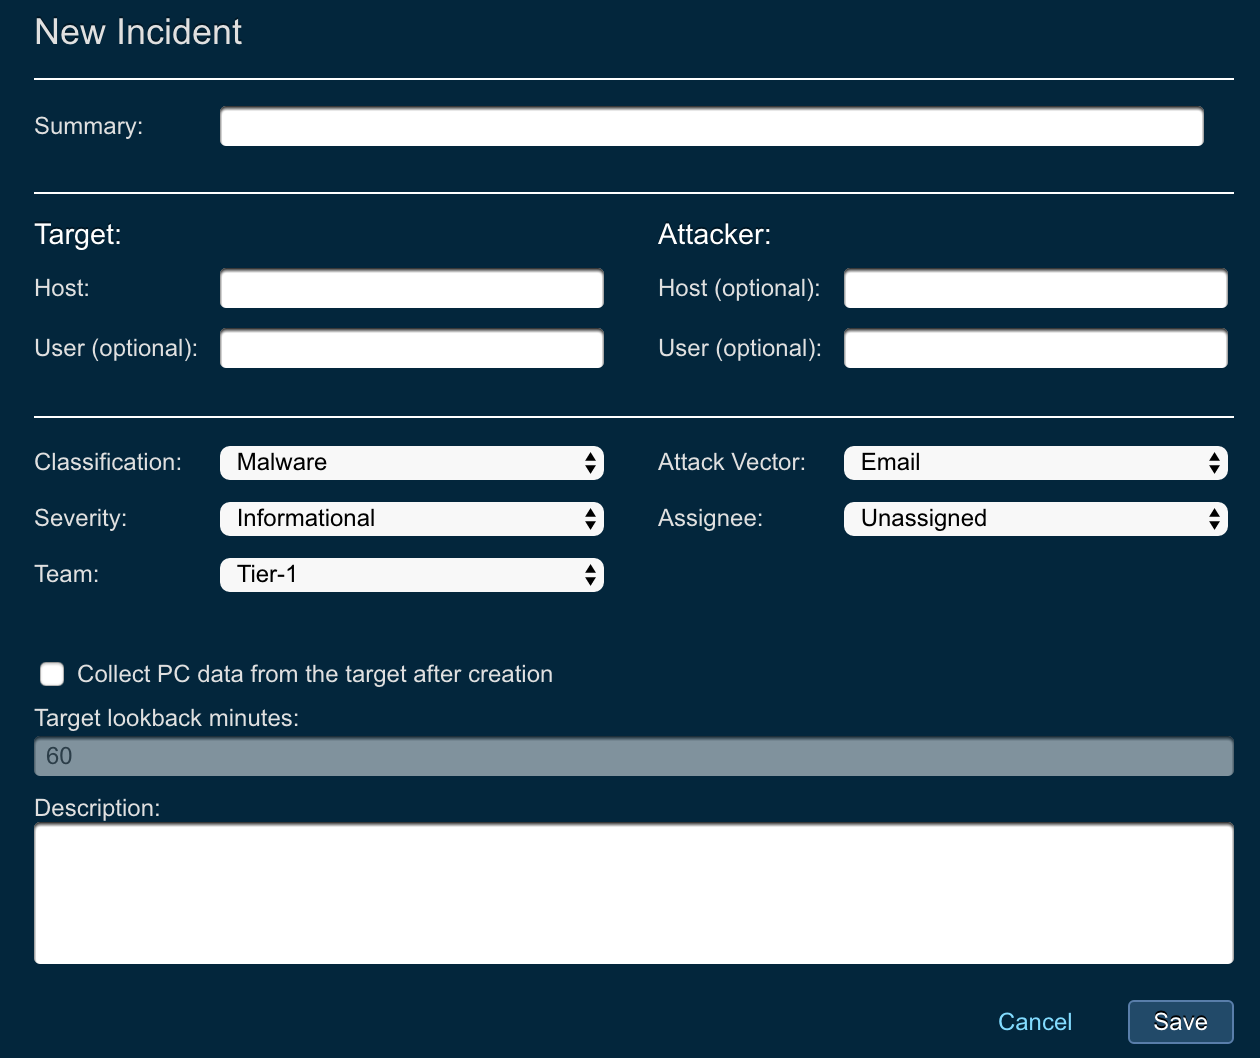
Users can also create incidents manually to begin an investigation on an internal system or to trigger PC data collection manually for a certain target endpoint.
To create a new incident manually:
- Navigate to the Incidents page in Threat Response.
- Click on the blue add “+” icon in the header to create a new incident.
- The following attributes can be set for the incident:
- Summary: summary for the incident activity
- Target: section that let’s users specify information about target host
- Host: hostname/IP of the target
- User: username of the target host (optional)
- Attacker: section that let’s users specify information about attacker host
- Host: hostname/IP of the target (optional)
- User: username of the target host (optional)
- Classification: classification of the incident
- Severity: severity of the incident
- Team: team that this incident will be assigned to
- Attack Vector: attack vector details for the incident
- Assignee: assignee that this incident will be assigned to
- Collect PC data from the target after creation: check if you desire to trigger PC data collection after manual incident creation
- Description: provide additional description for the manual incident
- Click on Save to create the new incident.
Assigning incidents to users
Incidents can be assigned to Threat Response users to establish ownership and for reporting purposes. To assign an incident to a user, click on the username text next to Assigned To on the bottom right-hand corner of the incident.
Closing incidents
To close an incident, click on the Close Incident button displayed on the right-hand side of all the open incidents. Incidents that are closed will no longer appear in the Open tab, but can still be accessed by visiting the Closed tab. Upon closing an incident, Threat Response displays a prompt enabling you to enter a comment describing the reason for the closure. Incidents can also be bulk closed by ticking off the checkboxes next to the incidents to be closed and then by clicking on the Close selected link at the top of the page.
To reopen an incident, locate the incident on the Closed page and then click on the Reopen Incident button.
Incident filtering and bulk actions
Threat Response enables analysts and IR managers to filter incidents and take bulk actions on them. The following bulk actions are supported in Threat Response:
- Close
- Change Team
- Add Comment
- Assign
- Link Investigation
- Undo Quarantine
Filtering incidents
Filters in Threat Response are applied to your incident list “view.” The following screenshot shows the list of “out-of-the-box” views provided to support the most commonly used incident filtering use cases.

In order to filter a list of incidents in a given view, click on the Filter link on the top right-hand side of the list. This action will present a pop-up to define the filter criteria, as shown in the screenshot below.

Applying the filter (below) filters the incidents to show only those open incidents where Splunk was the alert source within the last thirty days and with a reputation of Emerging Threats. You can clear the filter by clicking on the Clear Filter link in the green message bar.
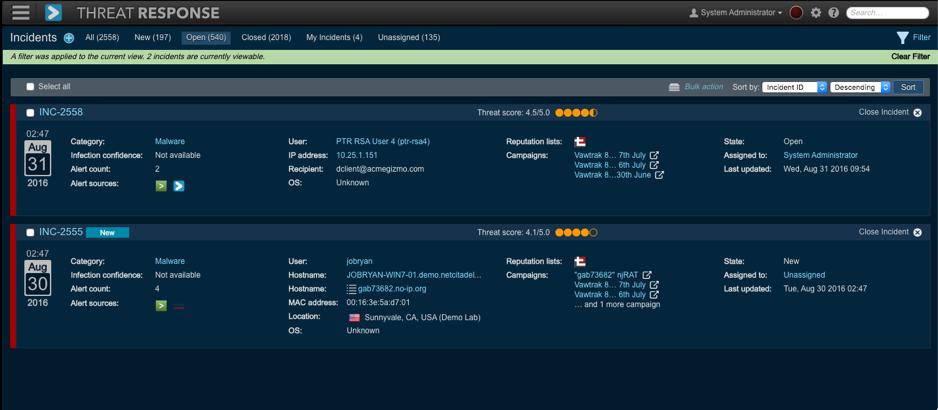
Filtering on the Closed Date is available only on the Closed tab, as shown in the screenshot below. This enhances the previous filter to show only those closed incidents where Splunk was the alert source within the last thirty days, with a reputation of Emerging Threats and which was closed in the last 24 hours.

Performing a Bulk Action
Performing a bulk action entails selecting one or more incidents. Either consider them individually or apply a filter and then click on Bulk Action on the list (of incidents).
The following screenshot illustrates that two incidents have been bulk-assigned upon applying a filter.

Warning
Be advised that an attempt to perform a bulk action for 20,000 or more incidents may result in an unresponsive UI. In other words, the action could be nullified. Thus be sure to filter the incidents to a lesser amount before you proceed.
Incident workspace
Access the Incident Details page by clicking on the Details link for any incident from the Incident list. The controls are laid out as follows:
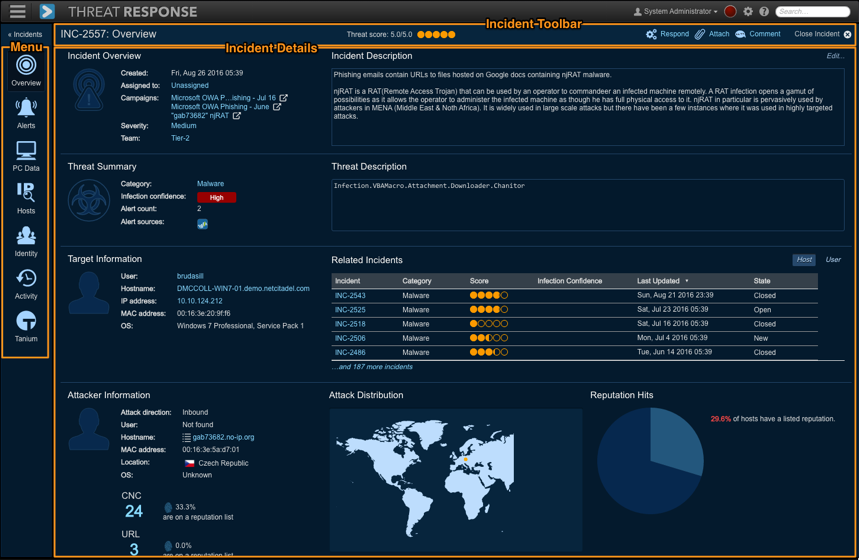
Incidents Toolbar
The Incidents Toolbar is located on the top right-hand side of the workspace (see below).

The Incidents Toolbar includes the following tools:
- Threat Score: The Threat Score displayed at the top of an incident
- Respond: The Create Response dialog displayed upon a click on the response link. This enables an analyst to take a response action on any malicious object identified within the incident.
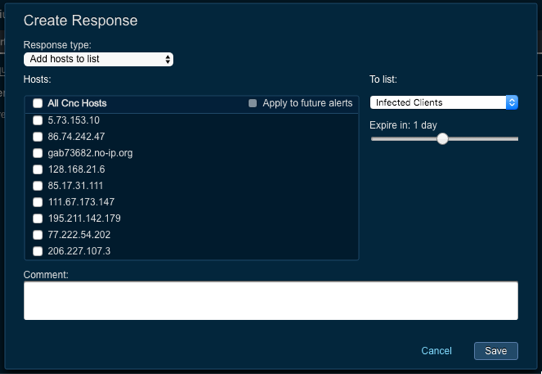
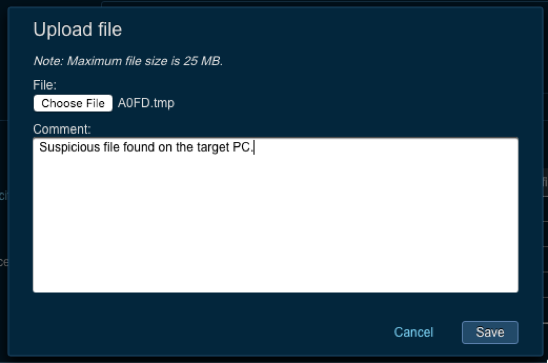
- Attach: (Clicking on) the attach link displays the Upload File dialog which enables an analyst to upload an attachment up to 25 MB.
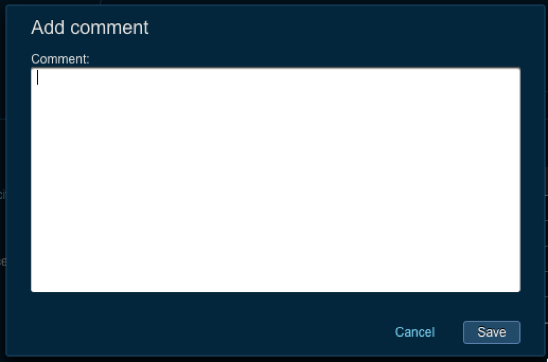
- Comments: (Clicking on) the Comment icon displays the New Comment pop-up to add a new comment to an incident. Comments are recorded in the Activity tab.
- Close Incident: (Clicking on) this button enables you to close or reopen an incident.
Incident Navigation Menu
The Incident Navigation menu items are stacked on the left-hand side of the workspace and the incident data is arranged in organized tabs. The navigation menu includes the following items:
- Overview
- Alerts
- PC Data
- Hosts
- Identity
- Activity
- Tanium
Note
The Tanium tab is only displayed if Tanium integration is enabled in the System Settings.
Workspace
The Workspace displays information about an incident. The content changes based on the page selected from the Incident Navigation menu. In the example at the top of this section, the Overview page is highlighted.
Reviewing Incident Details
Incidents contain many details about security alerts presented to Threat Response. To organize this data, Threat Response has divided the information into different sections. They are located in the navigation menu on the left-hand side of the page. This section describes each of the navigation menu items in detail.
Overview
Select the Overview page to view the summary of an incident.
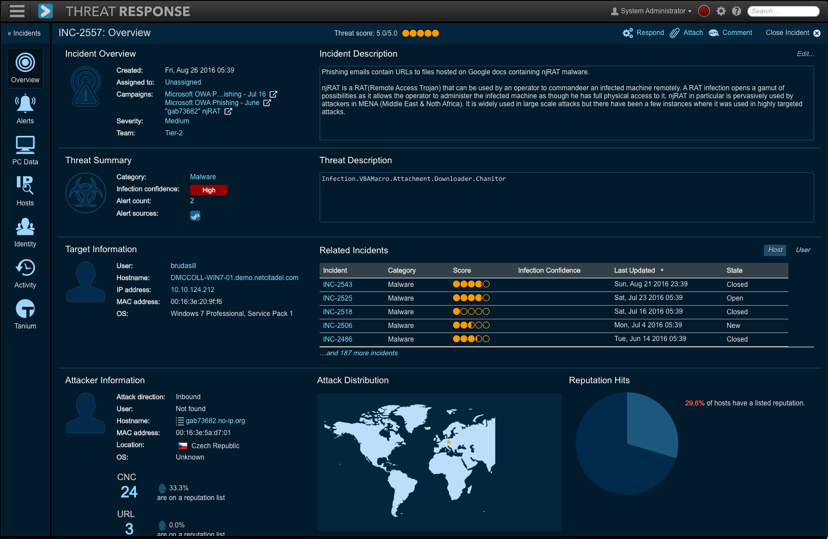
The Overview page is set up as a dashboard and separated into sections containing different pieces of information. Each section can expand or collapse to show more, or less, details.
Each section contains the following information:
- Incident Overview: The general information about an incident, such as its creation time, owner, and any custom fields created by the administrator. This section also provides a list of one or more Proofpoint email campaigns if their IOCs have matched one or more objects (URL, file hash, IP, host) in the incident.
- Threat Summary: The top 3 threats associated with an incident are listed in this summary. Threat Response attempts to determine the root cause of the event connected with the incident and displays that information here.
- Target Information: The system or systems that are being attacked
- Attacker Information: The system or systems that are doing the attacking
- Incident Activity Report: The information about what happened in the course of an incident’s existence. It displays a list of the event sources that reported alerts, a timeline of alerts, and a short list of recent activity within the incident.
Alerts
The Alerts page lists all the threats reported in the course of an incident’s existence. This page can be used to review individual alerts or to see a general flow of alerts reported by the system.
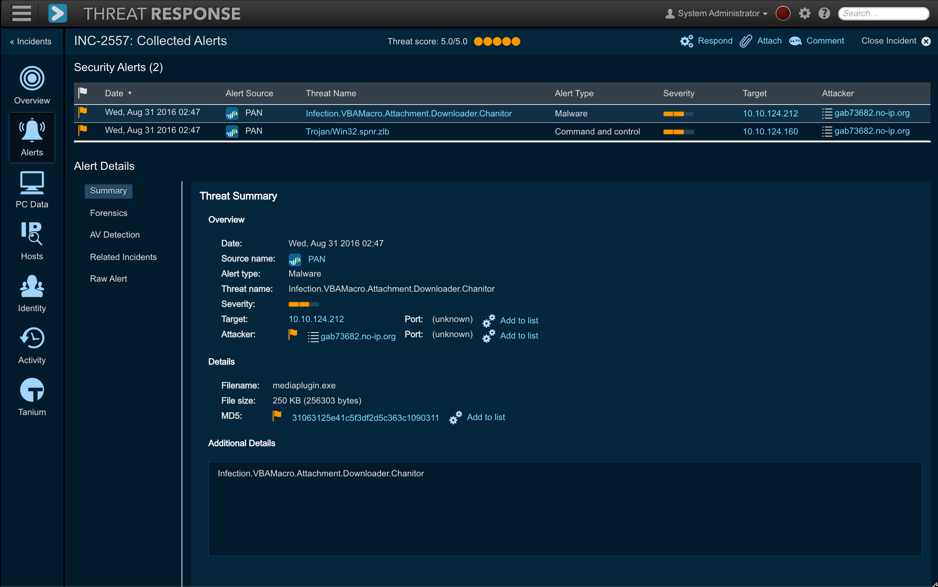
The Alerts page contains several items that are described below.
Security Alerts list:
Security alerts list shows all the alerts reported in an incident in chronological order. Clicking on an individual alert shows the details about the threat (on the right-hand side). By default, the most recent alert is selected in the UI.
Alert Details:
Alert details represent the high-level overview of what was reported in an alert. The following additional facts are divided into tabs:
- Summary: The additional particulars about an alert. The summary may include an overview of malware, a vulnerability, or other details, such as why the alert was triggered.
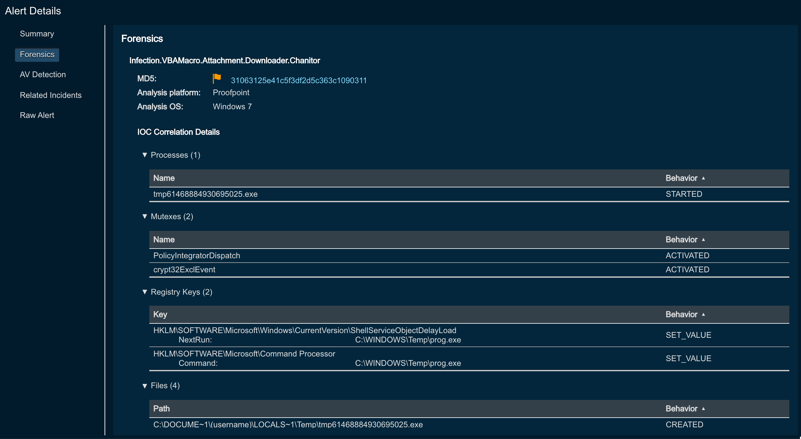
- Forensics: The malware analysis report provided by the sandbox that generated the alert. If a PC data collection has been performed, Threat Response reports items that matched between the sandbox’s report and the endpoint in the PC data section.
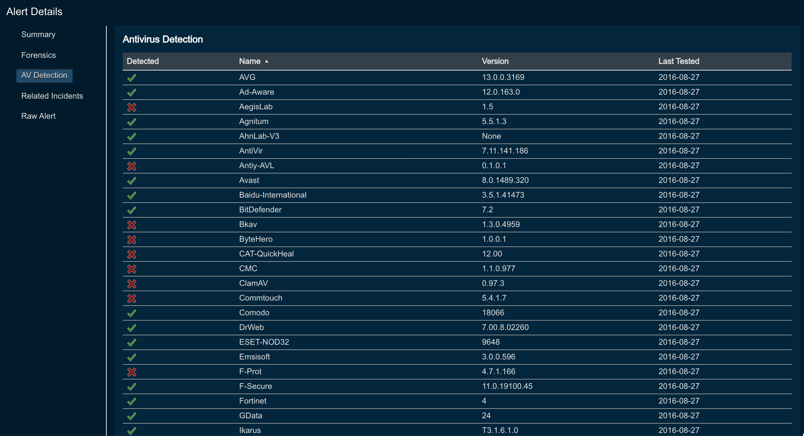
- Antivirus Detection: A list of the antivirus vendors that are able to detect the reported malware
- Related Incidents (Activity Tab): A list of other incidents in which a threat has been reported
- Raw Alert: The raw alert, as received by Threat Response
PC data
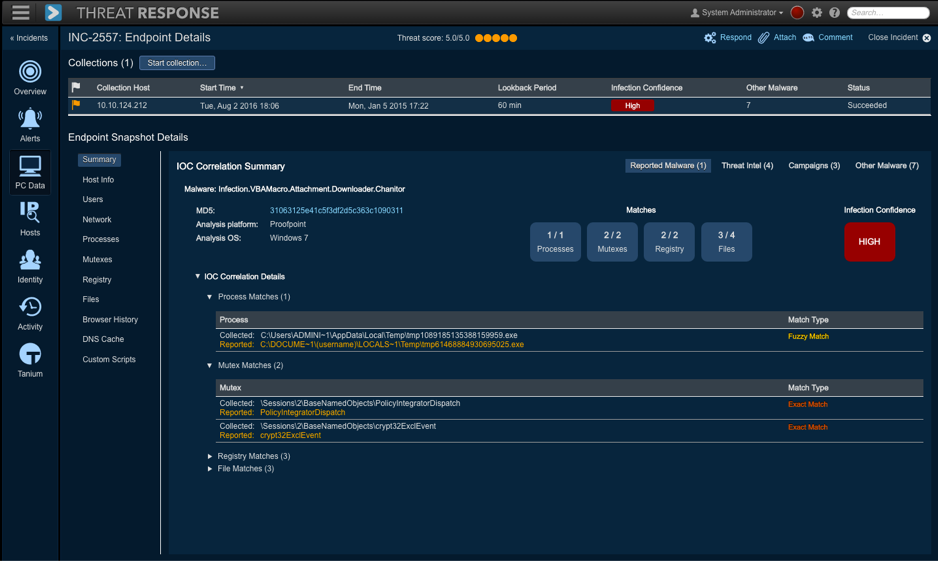
Select the PC Data page to view snapshot data collected from internal systems. This data collection can be configured to run automatically as alerts are received or can be run manually by a Threat Response user.
The collected information includes:
- Summary
- Host Information
- Users
- Network Connections
- Running Processes
- Active Mutexes
- Registry Changes
- File Changes
- Browser History
- DNS Cache
- Custom Script (if configured)
Note
For more information about the collection of information and IOC correlation details, please read the PC Data Collection Guide.
Starting a PC data collection
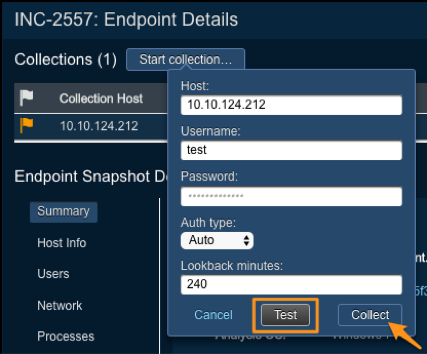
To start a collection, click on the Start Collection button. In the pop-up window, enter the PC’s IP address and password, the domain’s username and then click on Collect. Threat Response shows the status of the collection as it runs.
Threat Response supports NTLM and Kerberos for secure authentication to an endpoint for PC data collection. To set up secure authentication:
- Select an incident from the Incidents page and then click on Details.
- Click on PC Data from the toolbar on the left.
- Click on the Start Collection button and then select either NTLM or Kerberos from the Authentication Type drop-down menu.
Note
NTLM can be used on any machine (including standalone machines), while Kerberos can only be used on machines joined to the domain.
Hosts
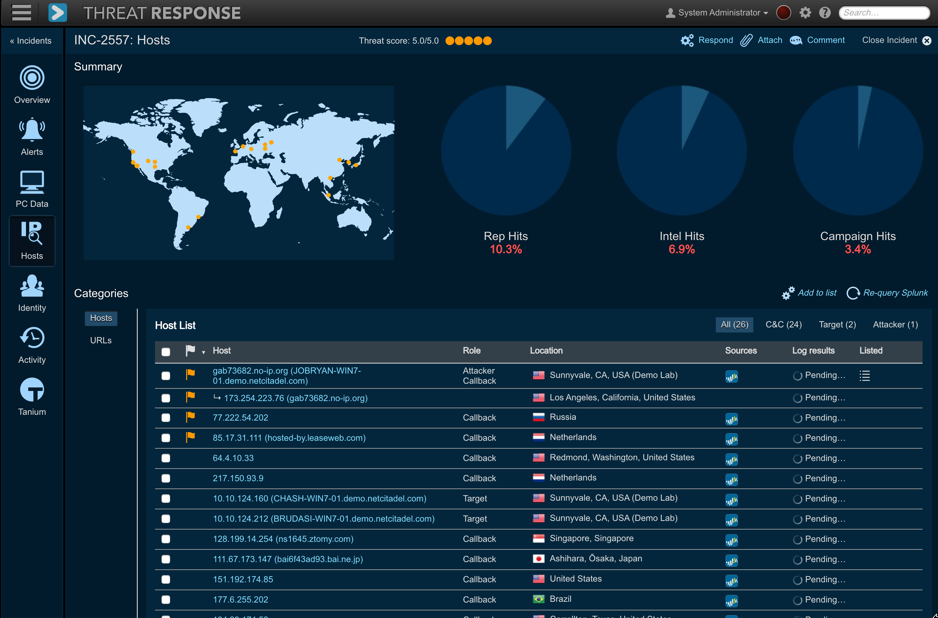
The Hosts tab displays detailed information about hosts and URLs associated with an incident and allows a user to take action. The Hosts page contains the following subtabs:
- Hosts
- Target Hosts
- Attacker Hosts
- Command-and-Control Hosts (CNC)
- URLs
Each subtab shows details about the hosts or URLs displayed, such as an indicator icon to show whether the item is on a Threat Response list, the geographic location of the host, and reputation facts.
SIEM Log Collection
In addition to displaying general details about each item, Threat Response can also query a SIEM appliance looking for logs containing those items. These logs are pulled into and displayed directly in Threat Response.
For more details about SIEM Log Collection, please refer to the appropriate Threat Response integration guide for your SIEM vendor.
Creating Responses
Response actions can be taken from the Hosts page. To take action on an item, or multiple items presented on the page, use the steps below:
- Using the checkboxes, select the items upon which to take action.
- Click on Add to List to open the response pop-up window.
- Select a list type.
- Use the slide to select an expiration time period.
- Optional: Add any comments.
- Optional: Click on the apply it to future alerts checkbox.
Identity
The Identity page displays information about a user reported in an incident, recent incidents in which the user has been involved, as well as any LDAP information available for the user (see below).
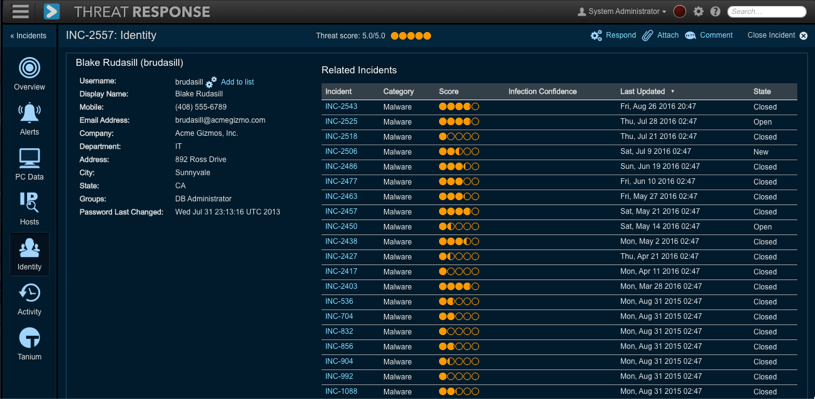
Additionally, an administrator can add users to a user list from the Identity tab by clicking on the Add to List link.
Activity
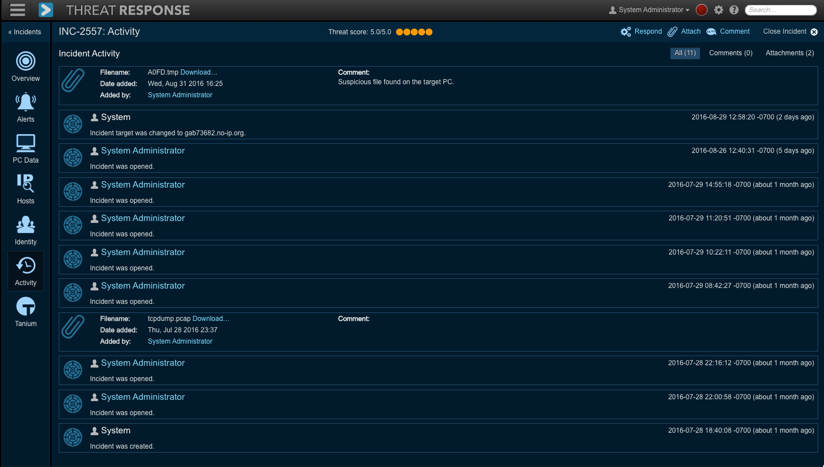
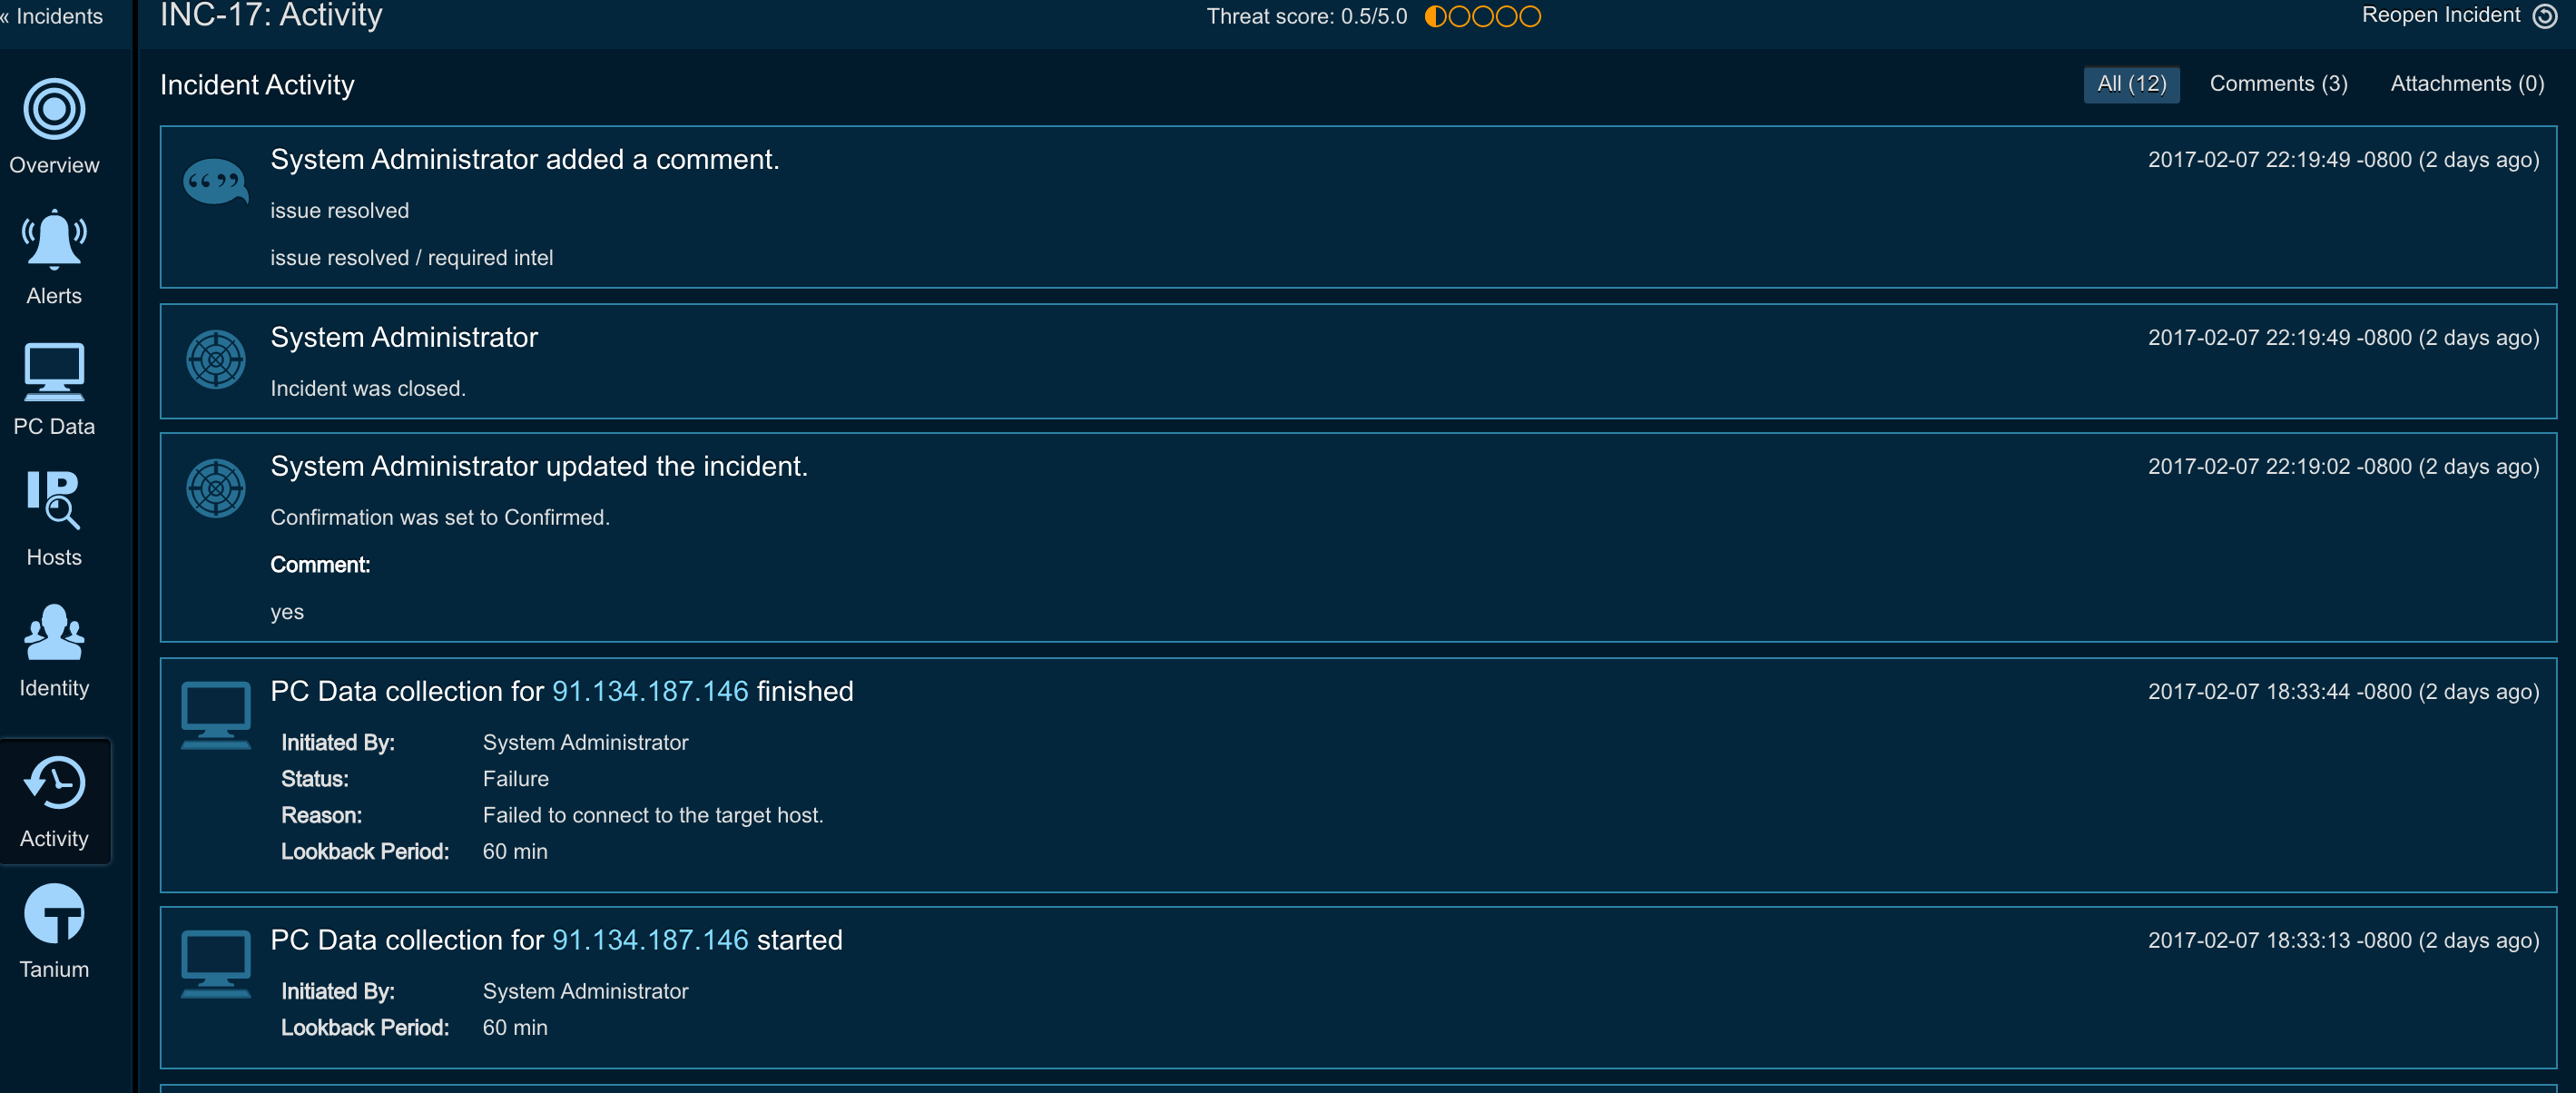
Select the Activity page to view the activity of an incident. The Activity page records all the user interactions within the incident, including:
- Incident State Changes
- Manual Responses Created by Analysts
- Automatic Responses Created by Match Conditions
- User Comments
Tanium
The Tanium tab is displayed when Tanium integration is enabled in the System Settings. It allows Threat Response to interface with the Tanium endpoint management platform to query information about endpoints reported in an incident.
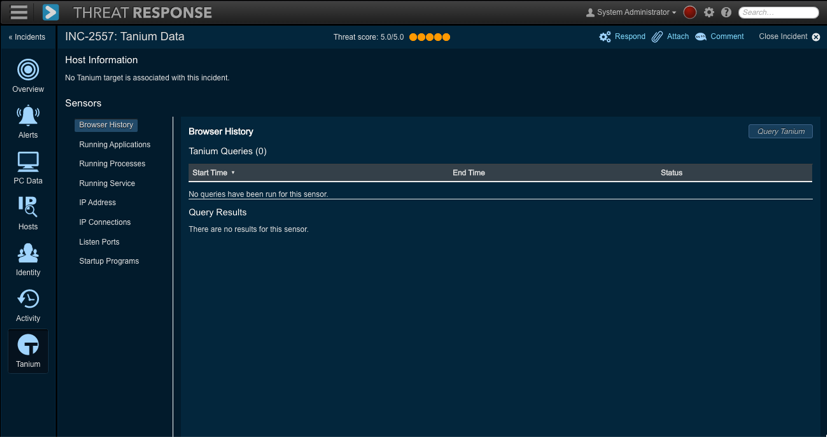
This query works by triggering Tanium to run one of its sensors against the endpoint. Tanium is equipped with many “out-of-the-box” endpoint sensors and also allows administrators to define their own sensors. This means that administrators can build custom sensors in Tanium that can then be used as references by Threat Response.
To learn how to configure Tanium integration, please, refer to the following page Tanium configuration.
Investigations
Threat Response Investigations is the high-level concept that allows users to group related incidents together. There are multiple use cases for investigations, and as a couple of examples, let’s take a look at the following:
- If there is a malware outbreak within the enterprise, analysts can group related incidents together, since the root cause of the outbreak can be the same. Once the malware infection is confirmed on the endpoints, incidents for those endpoints can be linked to a single investigation.
- If an analyst is able to track multiple stages of cyber attack and identify activity from various stages of kill chain (web exploit, execution, persistence, callback), he can group all these incidents into a single investigation in order to track all activity as part of single entity.
Investigations are now accessible as part of the Threat Response navigation menu.

Creating an investigation
To create an investigation, an analyst needs to perform the following:
- Click on the hamburger icon in the Threat Response navigation menu
- Click on the
Investigationsicon - Click on the
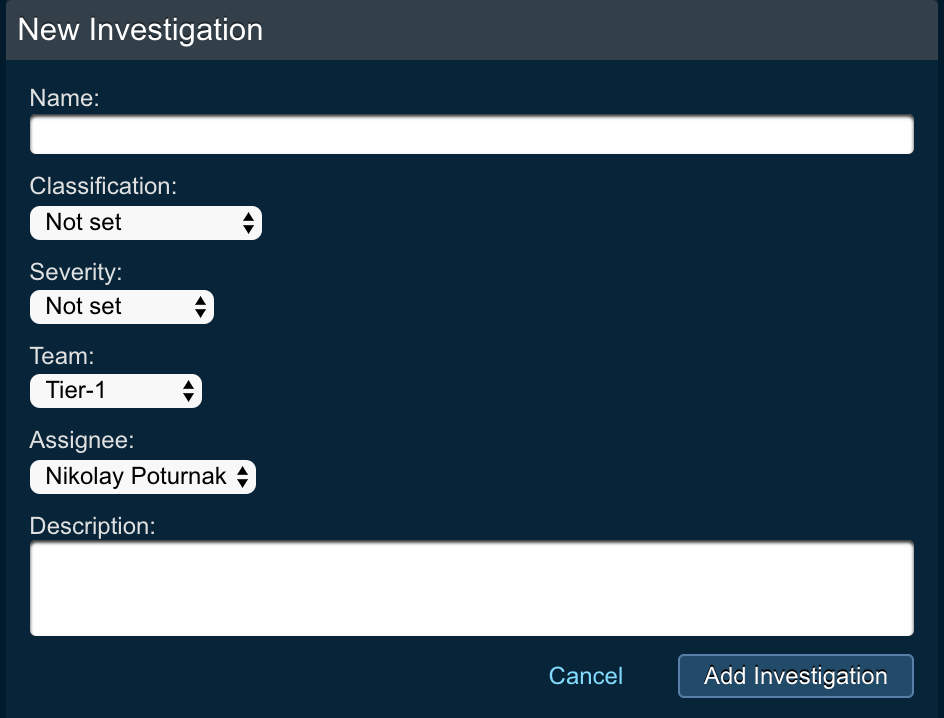
+sign next to theInvestigationstitle - Enter the Investigations details and click
Add investigationbutton- Name: name of the investigation
- Classification: classification of the investigation
- There are multiple categories that users can choose from, including, but not limited to
Malware,Hacking,Phishing,Spam,Data Leakage,Brute Force, and others
- There are multiple categories that users can choose from, including, but not limited to
- Severity: set the severity level of investigation
- Team: team who the investigation will be assigned to
- Assignee: user that the investigation will be assigned to
- Description: description for the investigation
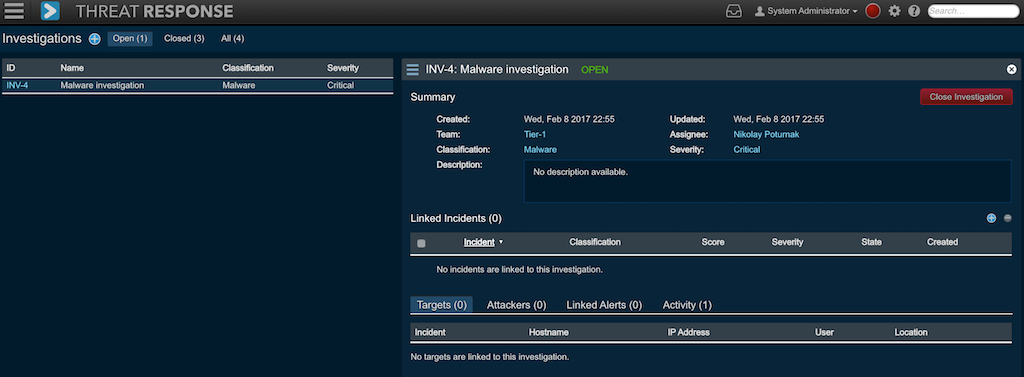
Once the investigation is created, it will appear in the Investigations table.
Linking incidents to investigation
Once the investigation is created, analysts can link one or several incidents to an investigation.
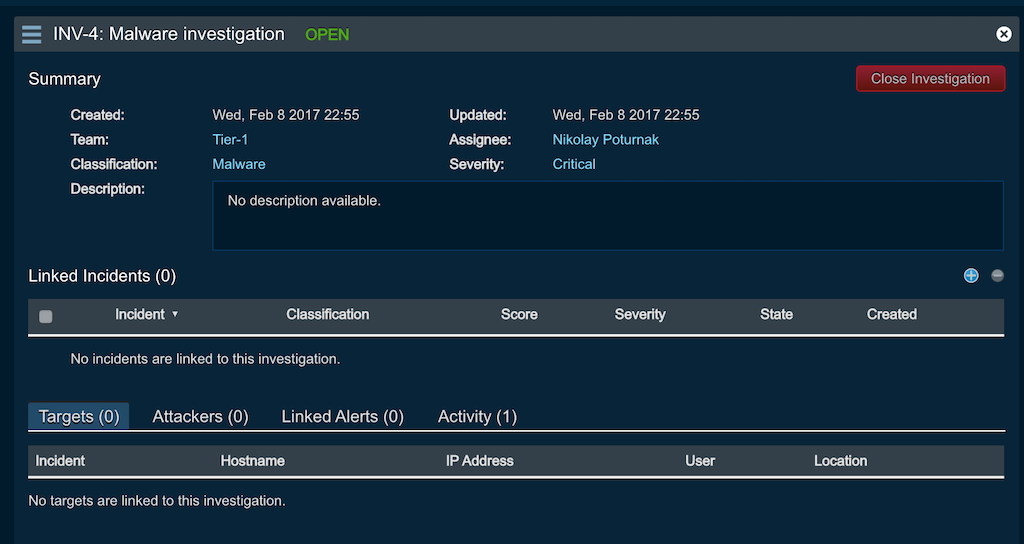
The following steps will perform linking from the Investigation view.
- Click on the hamburger icon in the Threat Response navigation menu
- Click on the
Investigationsicon - Choose the investigation that you want to link the incidents to by clicking on the investigation
IDlink - In the investigation details view, click on the
+link next to theLinked Incidentssection
- In the pop up window search for incidents using
ID,Assigned, orCreation date

- Once the incident is found, check the box next to incident id and click the button
Link selected incident(s). Several incidents can be linked at once.

- Once the linking is done, incident will appear as part of the investigation details view section
Investigation linking from incident view
It is also possible to link incidents to an investigation from the incident view. In Threat Response this can be done using the Incident List view, or Incident Details view.
- Click on the hamburger icon in the Threat Response navigation menu
- Click on the
Incidentsicon - Locate the incident that you want to link to an investigation
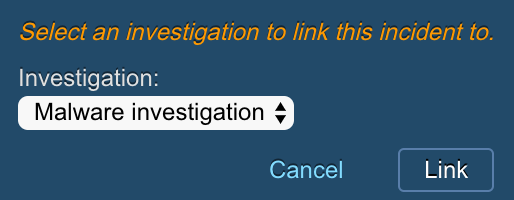
- Next to the
Investigationincident attribute click on theLinklink

- In the pop up window select the name of the investigation that you want to link the incident to
- Click
Linkbutton
Editing investigation
After the investigation is created, users can change investigation fields, such as Severity, Classification, Team, or Assignee or edit the investigation details using the Edit menu option.
In order to change investigation fields, users need to perform the following:
- Click on the hamburger icon in the Threat Response navigation menu
- Click on the
Investigationsicon - Choose the investigation that you want to change the attributes for by clicking on the investigation
IDlink - In the investigation
Summarysection, you can click on the link next toSeverity,Classification,Team, orAssigneeto change the value of any of those attributes - In the pop up menu, choose the value from the drop down list and click
Save

In order to change investigation details, users need to perform the following:
- Click on the hamburger icon in the Threat Response navigation menu
- Click on the
Investigationsicon - Choose the investigation that you want to change the attributes for by clicking on the investigation
IDlink - Click on the hamburger menu in the investigations details section
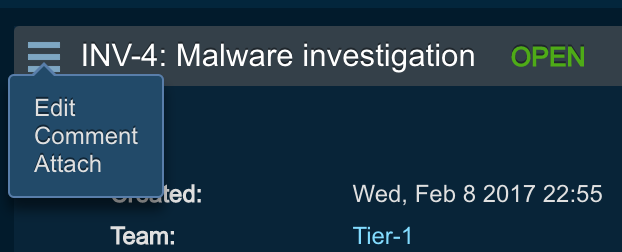
- Click
Edit - Edit the investigation details and hit
Save changes
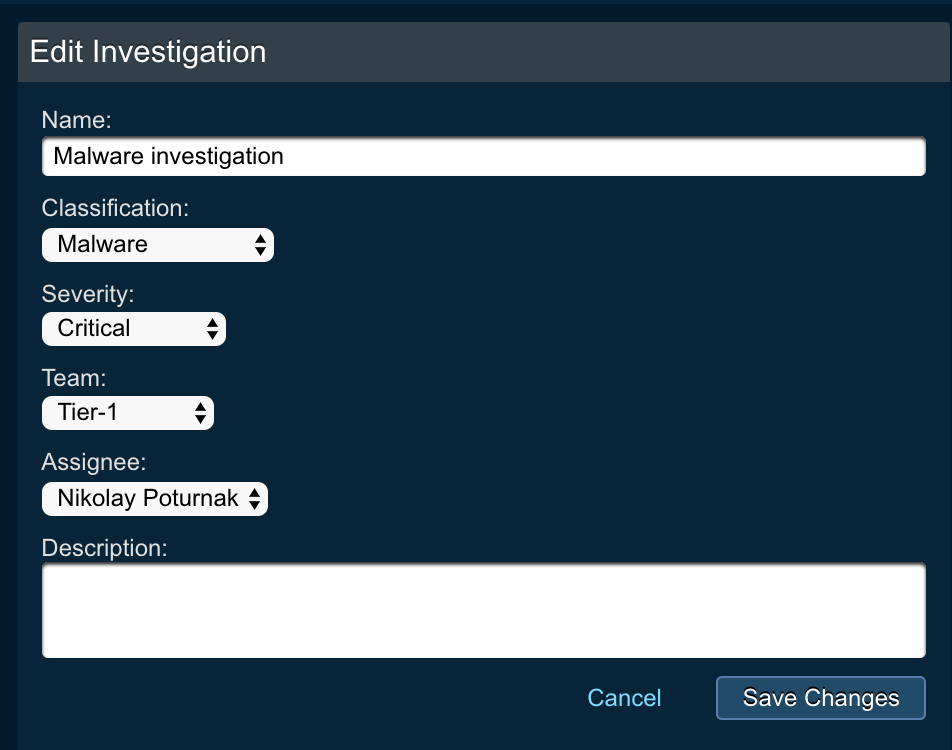
Attaching file to an investigation
Analysts can attach files to investigations. These files will be uploaded and stored in Threat Response memory.
- Click on the hamburger icon in the Threat Response navigation menu
- Click on the
Investigationsicon - Choose the investigation that you want to attach the file to by clicking on the investigation
IDlink - Click on the hamburger menu in the investigations details section
- Click
Attach - In the
Upload filepop up, choose the file to upload, provide comments, and hitSave
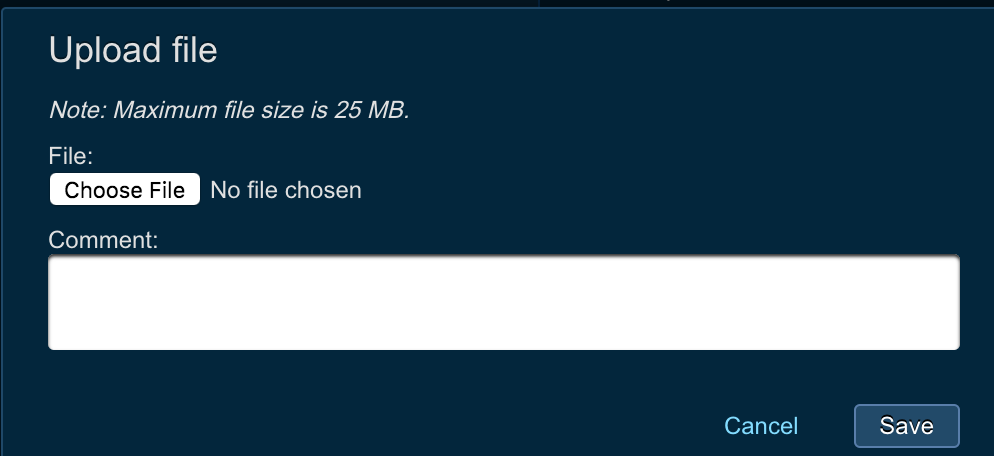
Closing an investigation
Analysts can close an investigation after they have completed the investigation process of the related incidents and activity.
- Click on the hamburger icon in the Threat Response navigation menu
- Click on the
Investigationsicon in the menu - Choose the investigation that you want to close by clicking on the investigation
IDlink - Click
Close Investigationred button in the investigation summary section - Provide comments and hit
Close
Using team-based queues
In this section we will take a look at how to use teams and enable team-based workflows. If you are interested in learning more about how to configure teams, please, refer to the following Administration Guide section:
Starting with Threat Response 3.1.0, users can create teams and assign users to them. This mirrors closely the existing workflows of the Security Operations Center, where each customer has multiple teams, such as Tier-1, Tier-2, and Tier-3 analysts.
Incident list team filters
When analysts navigate to incident list page, starting from Threat Response 3.1, they can use the My team queue filter to immediately see what incidents are assigned to his team.

Setting the team using match condition
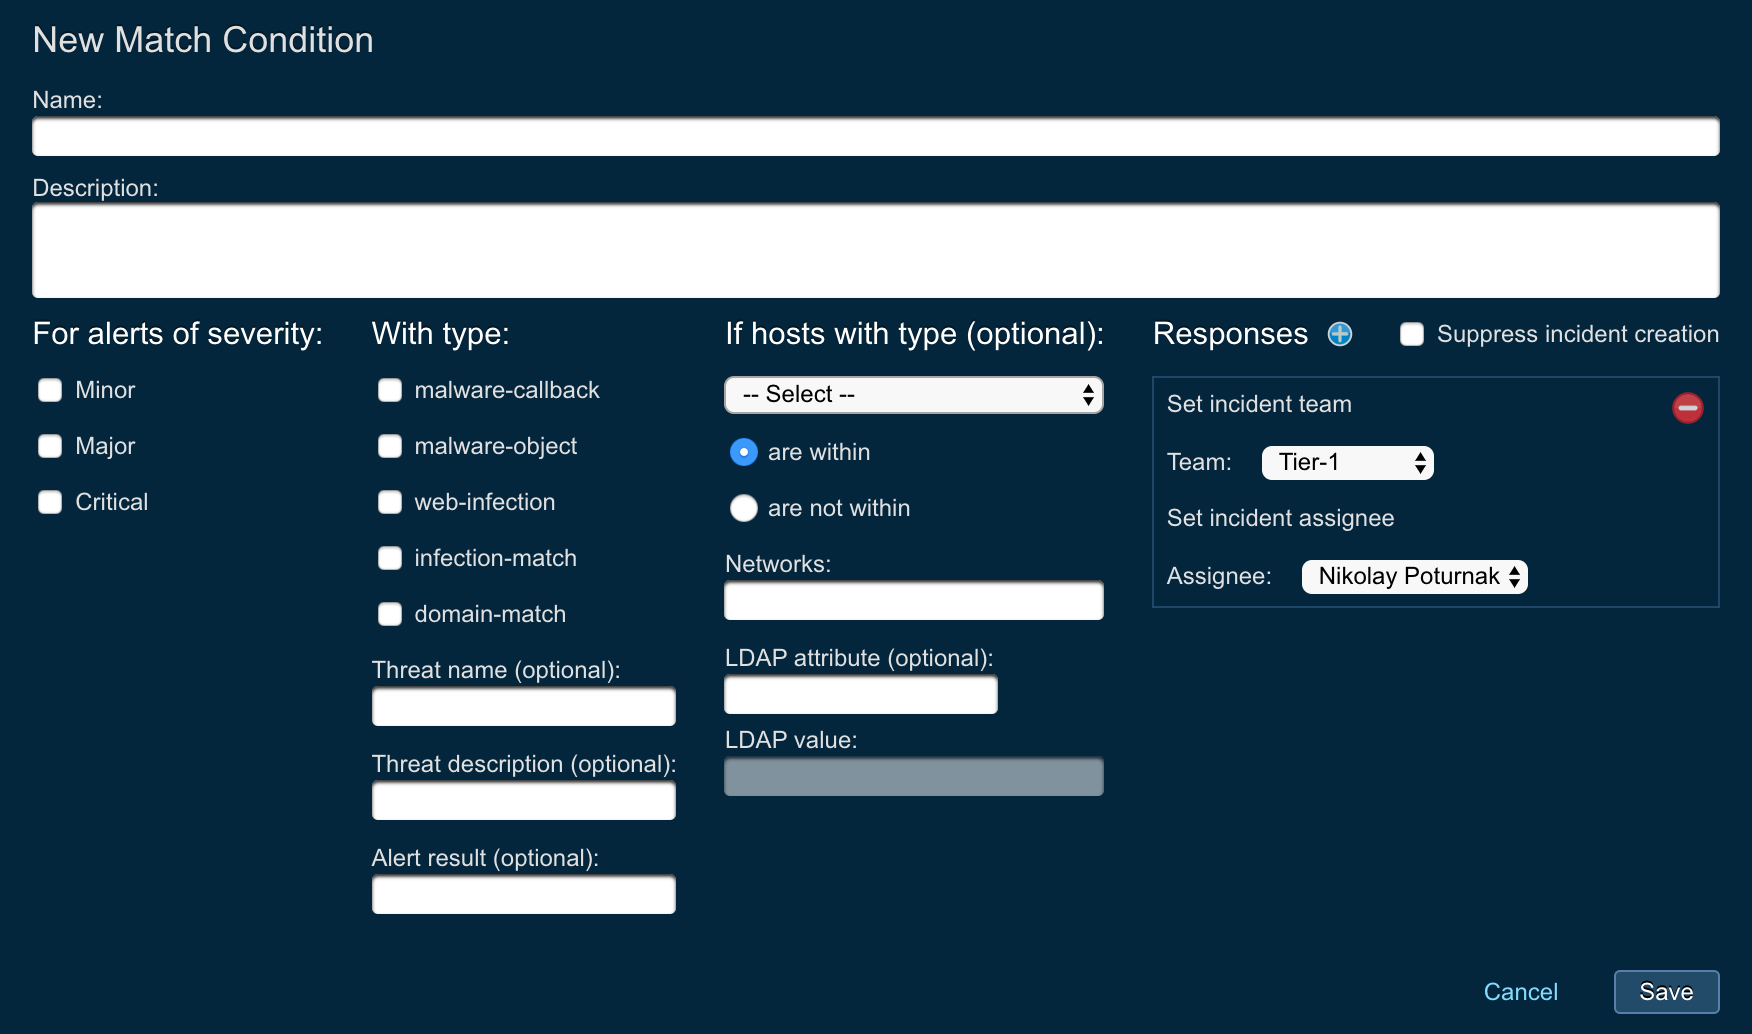
Match conditions allow analysts and admins to perform automated actions upon the incident creation in Threat Response. With the introduction of teams in Threat Response 3.1, it is now possible to automatically set incident team using match conditions.
In order to set the team using the match condition, perform the following:
- Log in to Threat Response
- Navigate to the
Sourcespage - Click on the existing source, or create a new one
- In the source details page, click on the
+next to match conditions title

- Create a new match condition and from the responses drop down menu choose
Set incident team
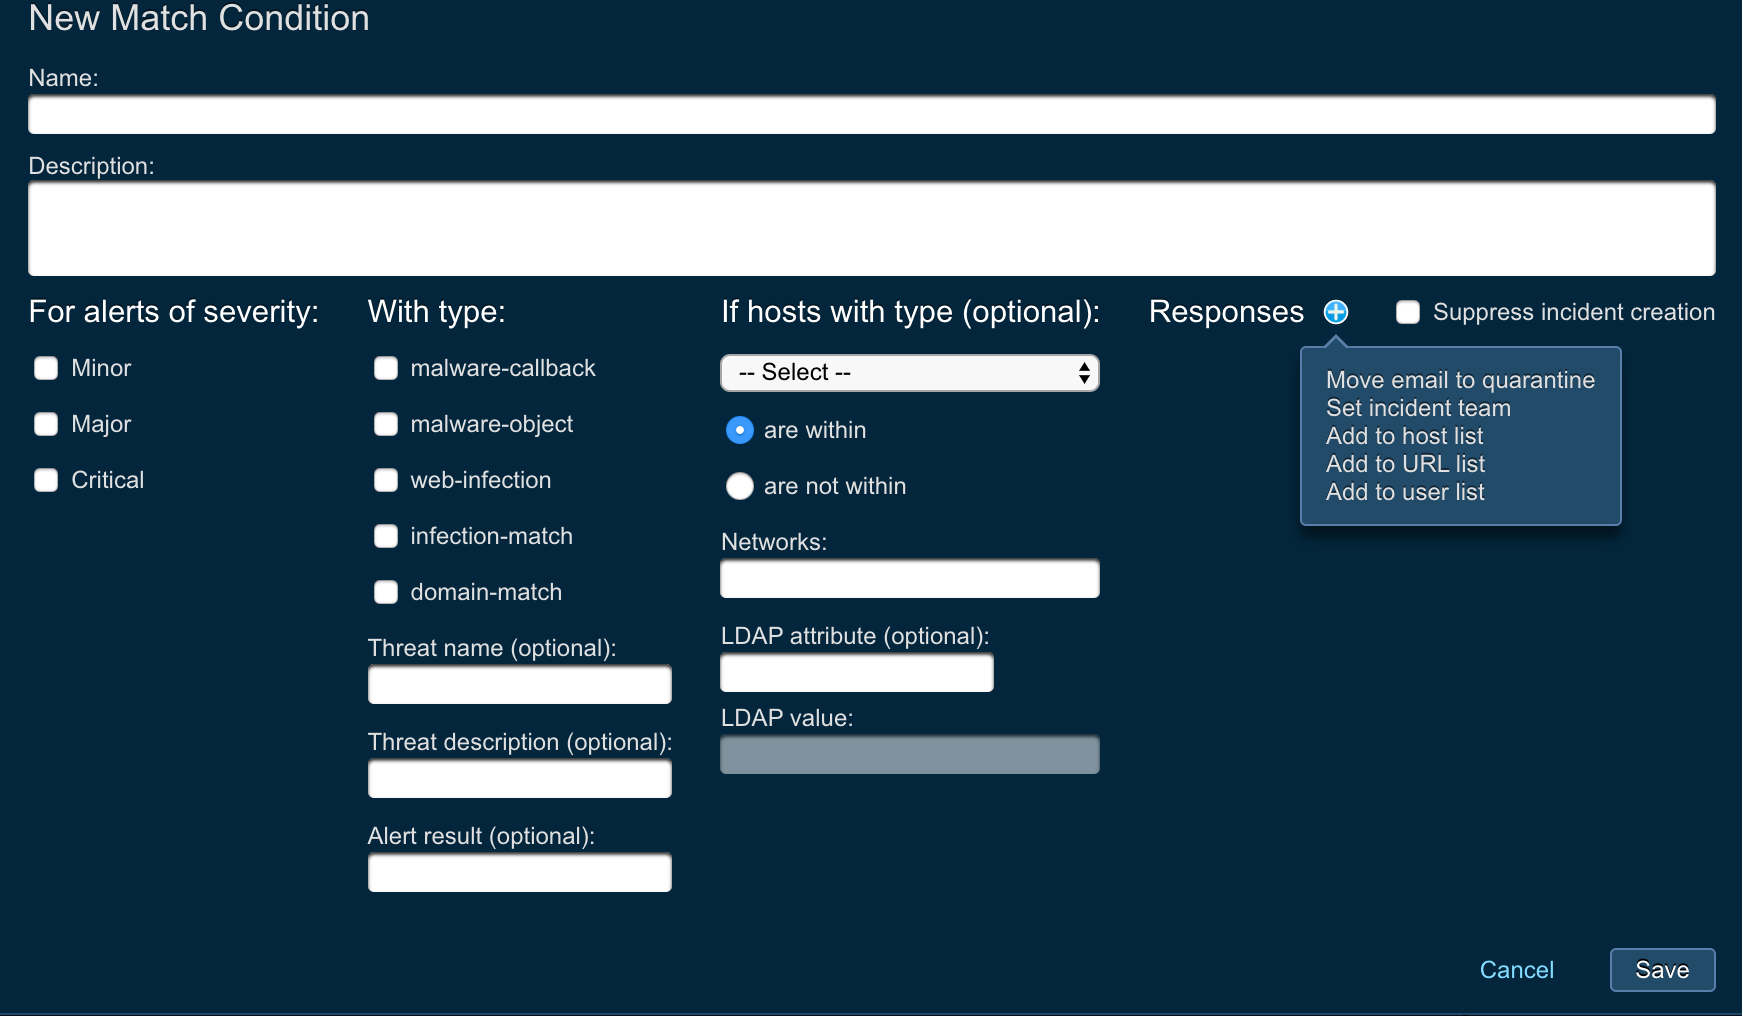
- Set the
TeamandAssigneevalues - Click
Save
Incidents by team report
With the introduction of teams, Threat Response offers the new report that shows the incidents by team overview.
- Log in to Threat Response.
- Navigate to the
Reports>Incidents by teamreport
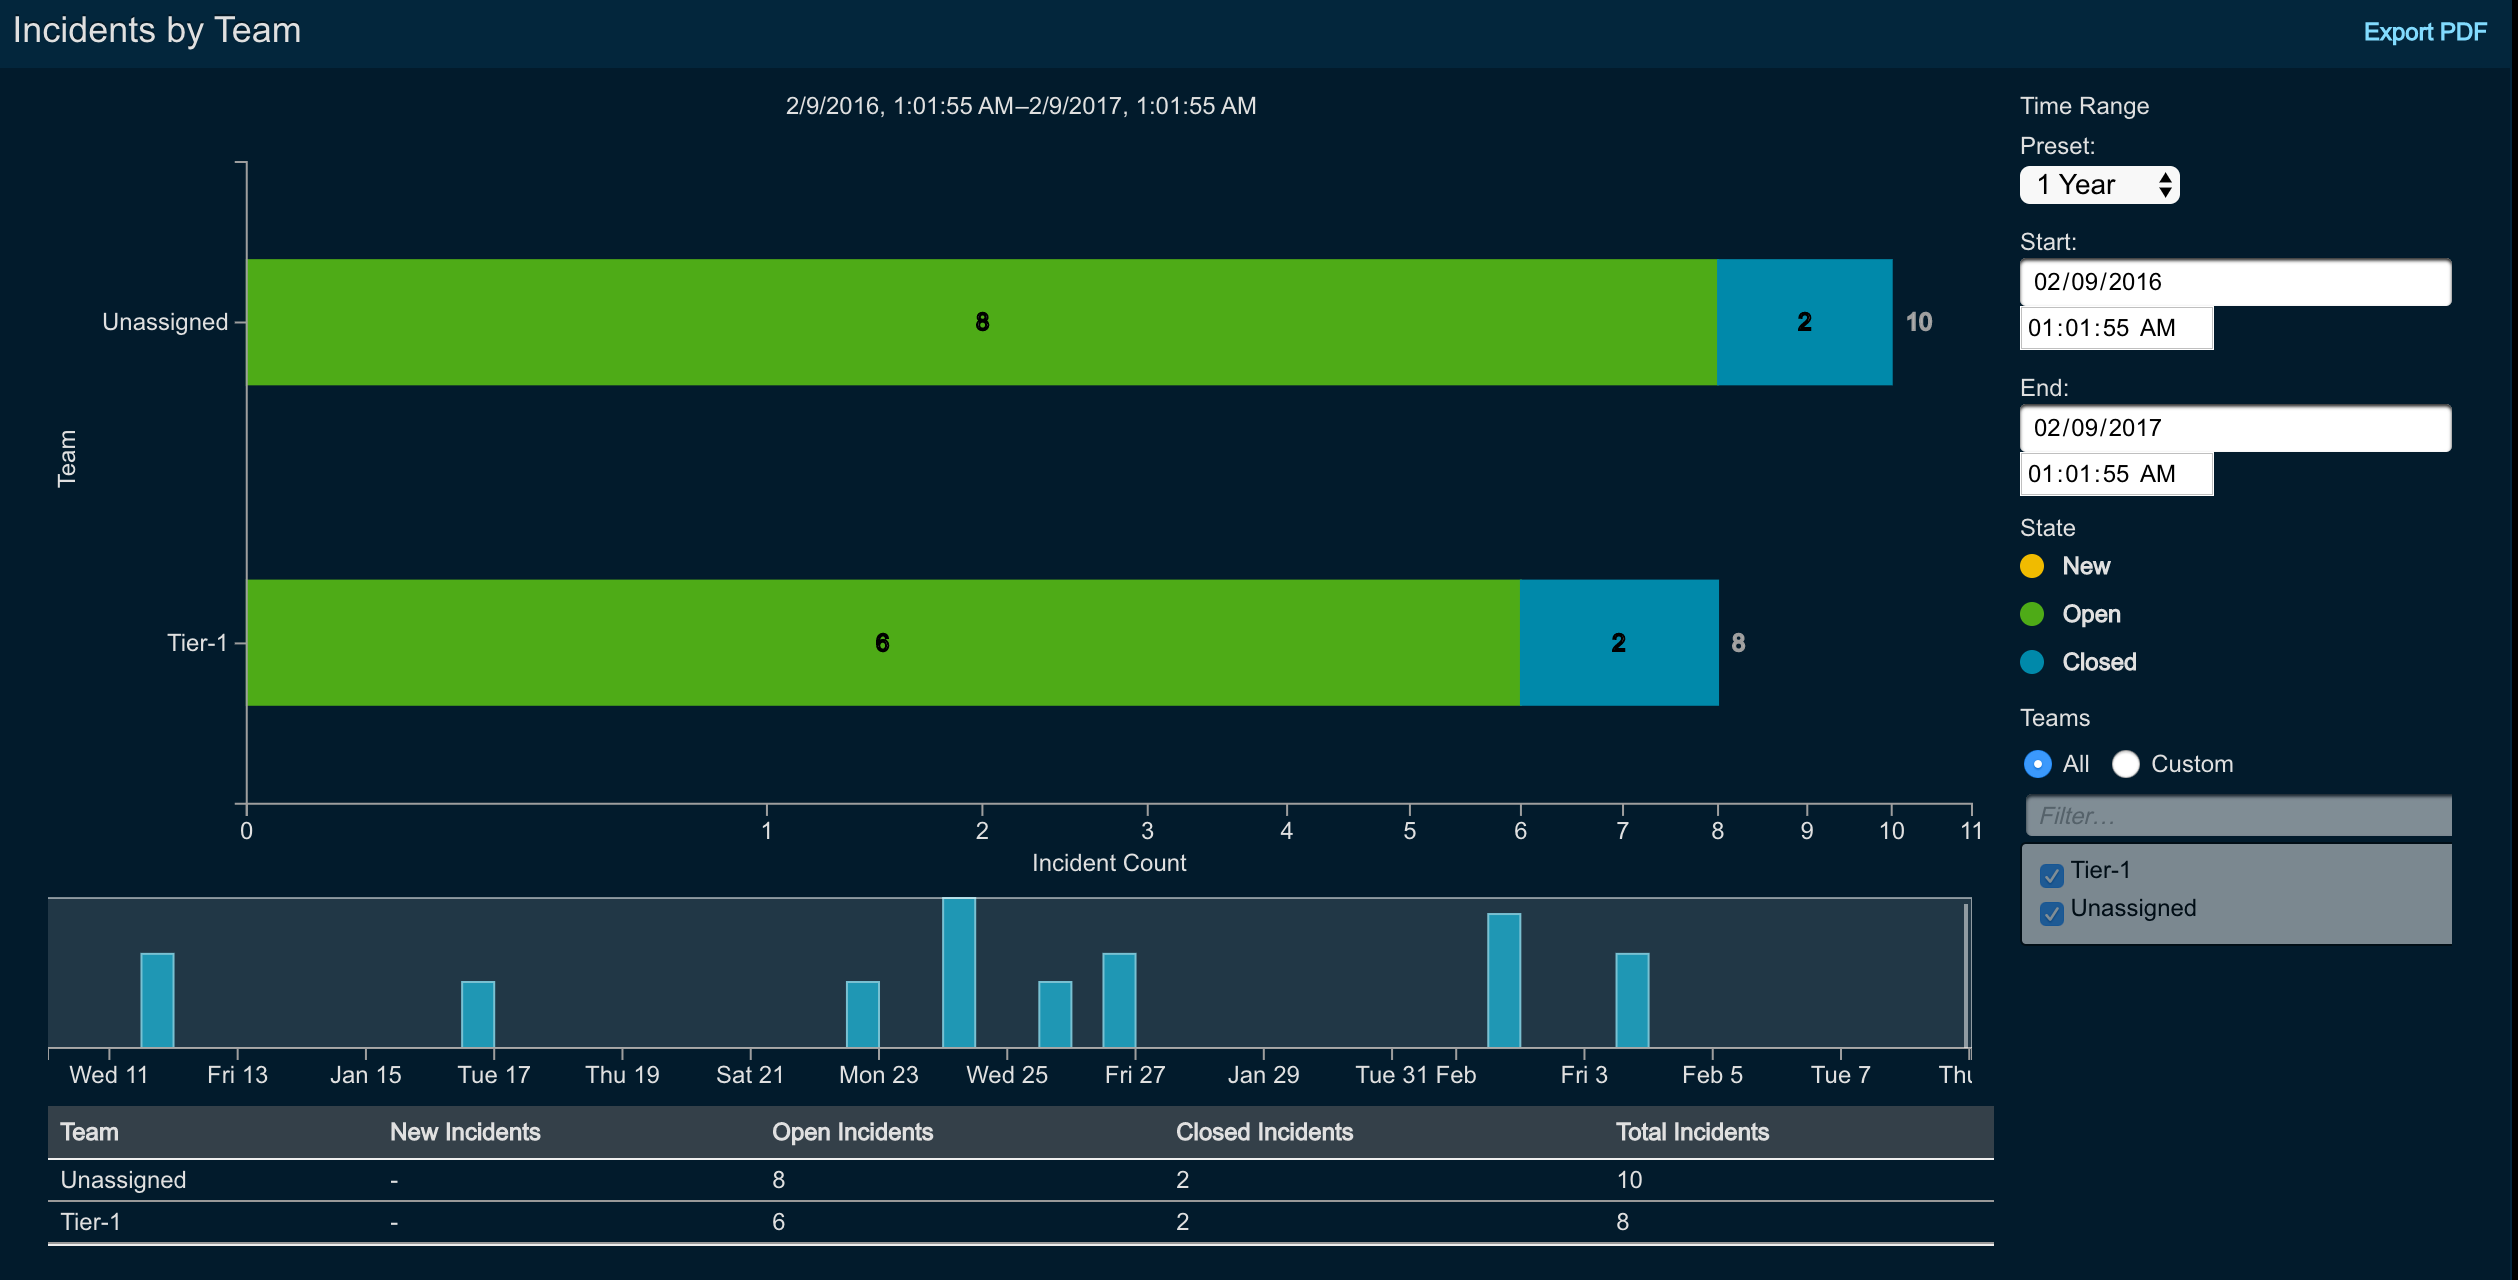
Users can define and adjust the time range for the report, filter out certain teams for the report, as well as export the report in pdf format.
Incidents assignment to teams
Users of Threat Response can individually or as part of bulk action assign incidents to different teams.
To manually assign incident to a team, perform the following:
- Log in to Threat Response.
- Navigate to the
Incidentspage - Choose the incident that you want to assign to a team
- From the incident list page locate the
teamattribute and click on the associated link

- From the dropdown menu choose the team and assignee for the incident
- Click
Save
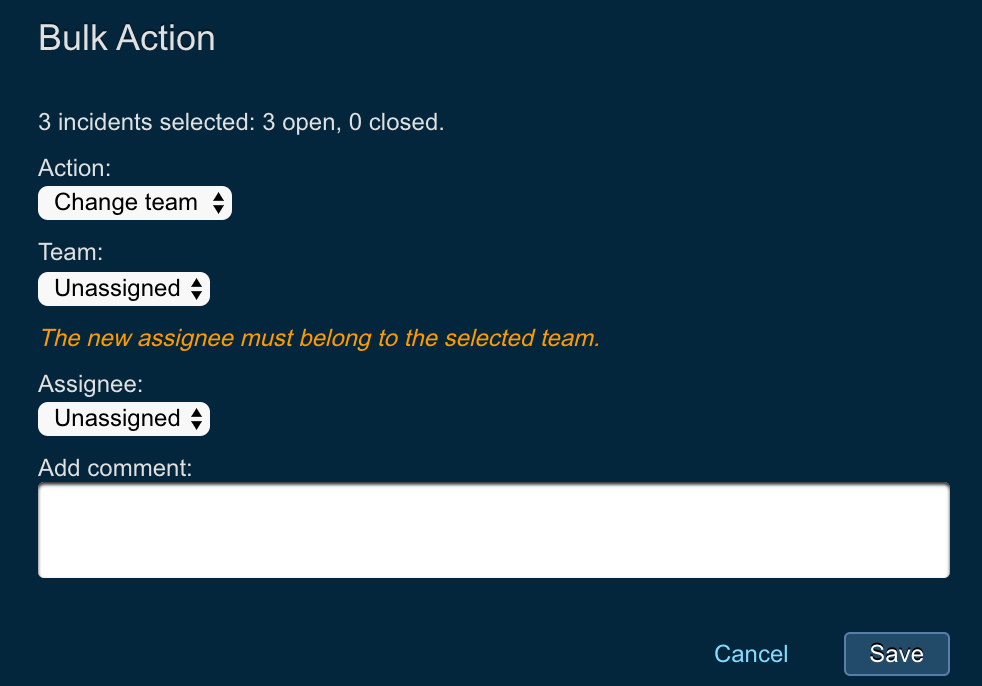
To assign several incidents to a team as part of bulk action, perform the following:
- Log in to Threat Response.
- Navigate to the
Incidentspage - Choose several incidents using the checkbox options
- Click on the
Bulk actionlink at the top of the Incident List page

- In the
Bulk actionpop up window chooseChange teamaction - Fill out the parameters:
- Team: team to assign the incident to
- Assignee: assignee to assign the incident to
- Add comment: provide additional comments for the assignment
Filter incidents by team
It is possible to navigate to the Incindents list page and filter incidents by team. In order to do that, perform the following:
- Log in to Threat Response.
- Navigate to the
Incidentspage - Click on the
Filterlink

- Click on the
+button to create new filter - From the dropdown for
Namecolumn, chooseTeam - Choose the operator
- = : equal
- != : not equal
- Choose the value for the team
- Click
Apply

Custom PowerShell scripts IOC collection
Starting with Threat Response 3.1, analysts can collect custom IOC data using one of several PowerShell script. Before the collection can be performed, the PowerShell scripts need to be uploaded to Threat Response.
In order to learn more about how to upload PowerShell scripts to Threat Response, please, refer to the following administration guide section:
Threat Response team created 6 PowerShell scripts that collect various endpoint information for demonstration purposes. You can use these scripts as a benchmark when you are creating your custom PowerShell scripts. The examples are available here:
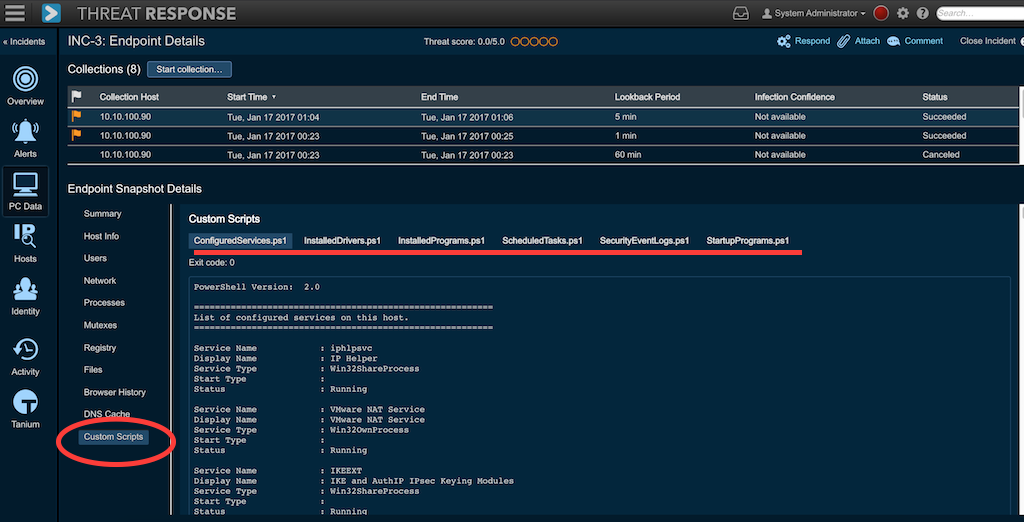
Once PowerShell scripts are uploaded to Threat Response and enabled in the System Settings, every time the PC data collection is performed, PowerShell scripts will be pushed to the endpoint using $Admin share. The scripts will execute, data output will be collected and displayed in the Threat Response UI.
In order to locate the PowerShell script output, perform the following actions:
- Log in to Threat Response
- Navigate to Incident List page
- Click the ID of the incident that you are investigating
- Navigate
PC Datasection - Click on the
Custom Scriptssubmenu - The custom script output will be recorded in the UI. Clicking on the title of the script (tabula view) users can navigate between all available scripts outputs.
Custom and standard incident fields
In this section we will take a look at how to operate and use custom and standard incident fileds in Threat Response.
If you need more details on how to configure custom incident fileds, please, refer to the following section in the Administration Guide:
Custom and standard incident fields
Using custom and standard incident fields
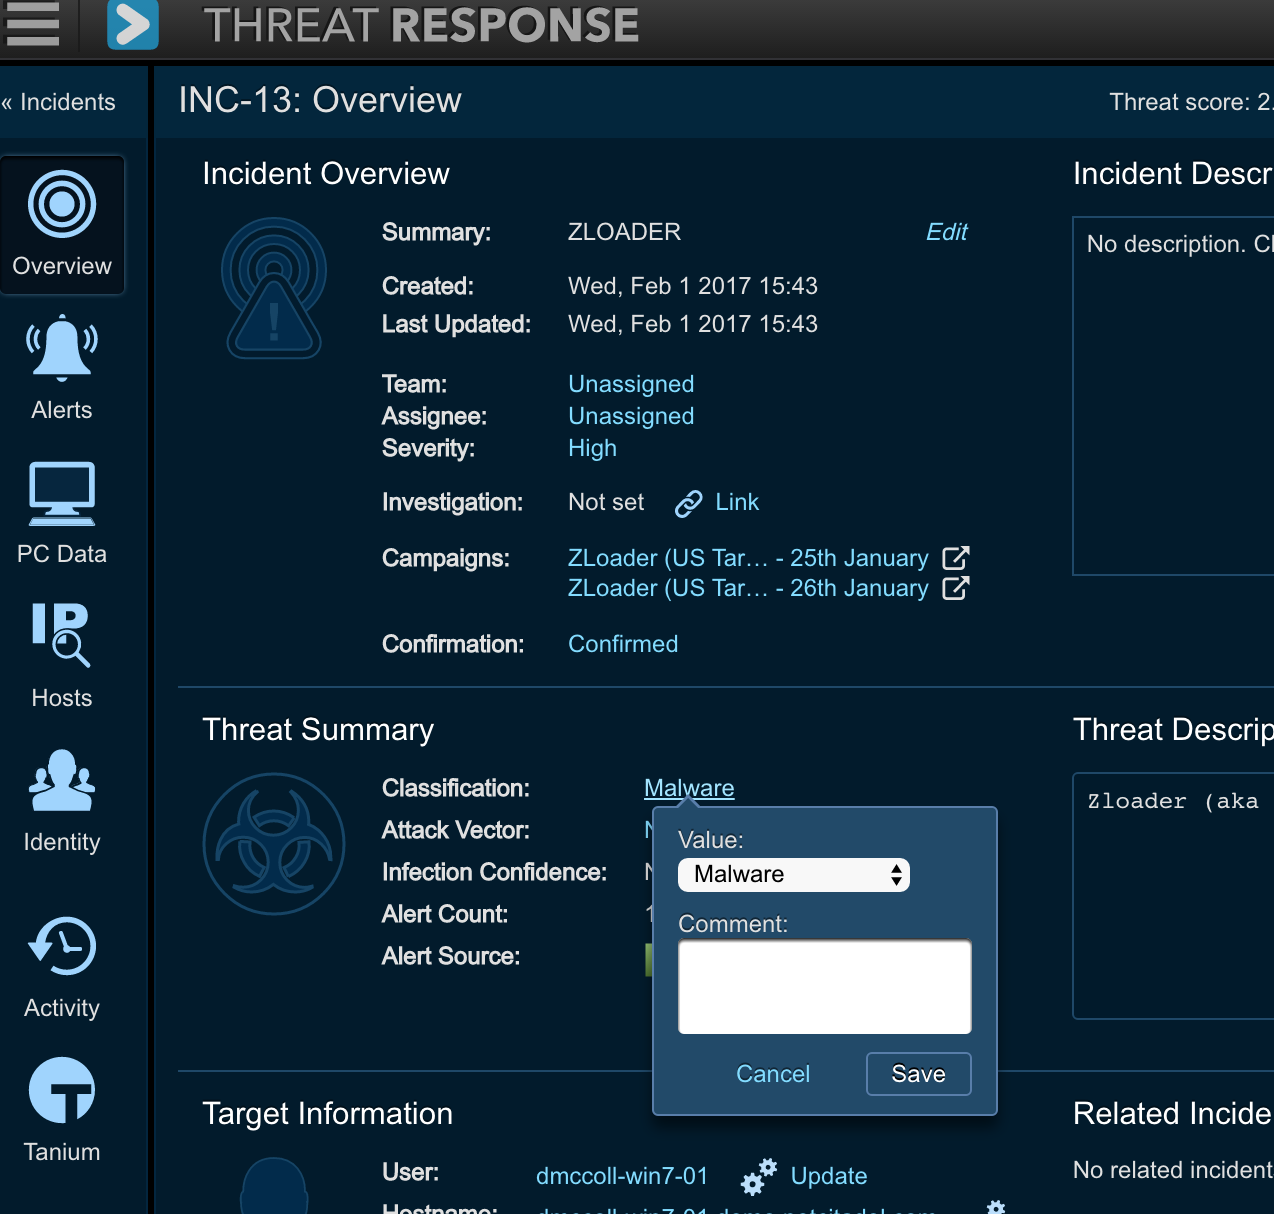
Incident fields provide context about the incident activity. Administrators can add a number of custom fields, and enforce those fields are present when the incident is attempted to be closed. Analysts, in turn, can manipulate the incident fields and define the values for them, either choosing from the list of available values, or inputing the value as a text field.
Incident fields can be changed from the Incident List page.
- Log in to Threat Response
- Navigate to
Incidents Listpage - Locate the incident that you need to change the fields for
- Click on the incident filed link (for example,
Classification) to change it value - Choose the value from the dropdown list
- Provide additional comments
- Click
Save

Users can change incident fields from the Incident Details page as well. Users would need to perform similar actions as described above.
Required incident fields
Administrators of Threat Response can define fileds that need to be present for the incident before the incident can be closed by an analyst. This is very helpful when admins want to make sure the reporting is accurate (if the reporting in generated for certain incident attributes) or when admin need analysts to consider certain things before the incidents can be closed.
Therefore, if the field is required, its value is not set, and analysts try to close the incident, Threat Response will display an error.

Therefore, before closing an incident, analysts need to make sure all required fields are present. Once that is done, analysts can close an incident using normal process.
Incident activity notifications
Threat Response now provides a Facebook-like activity notification for each incident assignee to notify him of changes that were made to his incidents.
Note
For all updates, if the assignee of the incident is the user who is editing it (e.g. Admin changes a custom field on his own incident), this does not trigger a notification.
Here is the full list of triggers that will generate the incident notification for the user:
- Creating a manual response for the incident
- Uploading an attachment
- Commenting the incident
- Closing the incident
- Editing the summary of the incident
- Changing the assignee
- Both the old and new assignee are notified of the change
- Example 1: Alice reassigns Bob’s incident INC-1 to Carol. Bob and Carol are both notified, and now Carol will receive future notifications for INC-1.
- Example 2: Alice unassigns Bob’s incident. Bob is notified, but no one else – and no one else will be notified of updates until the incident is reassigned.
- Changing the team - this also means the assignee must change, which triggers a second notification.
- Editing severity
- Linking an investigation (from the incident page or the investigation page)
- Unlinking an investigation (from the incident page or the investigation page)
- Editing a custom incident field (e.g. “classification”, “Attack Vector”)
- Updating the target or attacker user
- Updating the target or attacker host
- Creating a manual (contextual) response (e.g. “add to list”, “quarantine”)
- Starting a PC data collection (note: another notification will trigger when the collection finishes)
- When an alert is linked to an incident
- When a response is triggered from a match condition
Notification inbox is located at the top of the Threat Response menu bar.

Once the notifications are generated, assignee will be notified through the number appearing over the inbox icon.

Users can click on the notification inbox to expand the notifications information for more details.
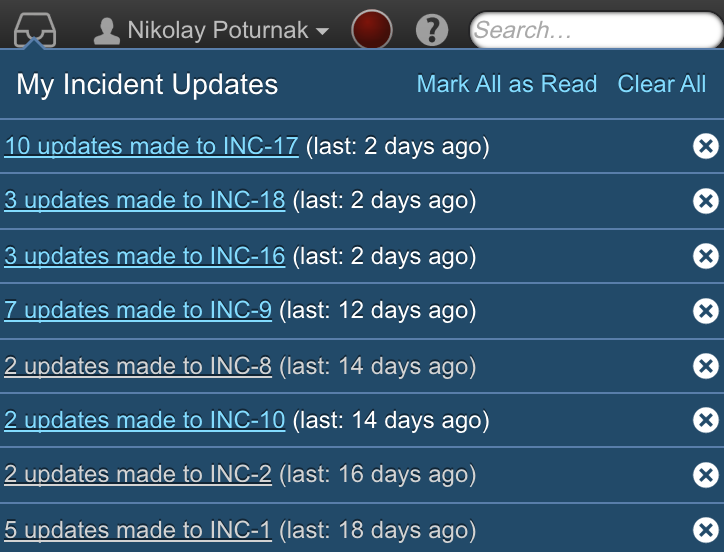
By clicking on the x sign, users can acknowledge the notification and clear it from the inbox. Moreover, by clicking on the notification link, users will be redirected to related incident activity, so that they can see more details about the change.
User profile preferences
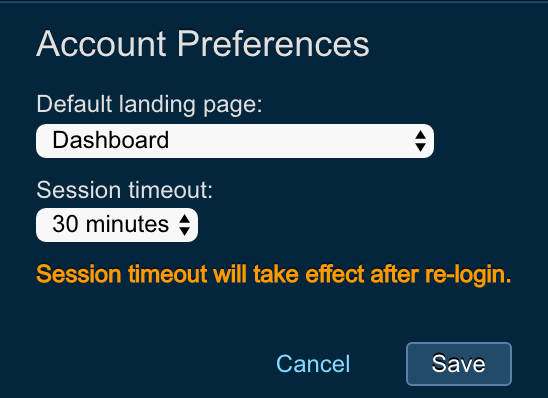
This feature lets Threat Response users/analysts set their personal preferences for the following configuration settings:
- Default landing page (dashboard, incident list, CTI list) - that means that when user logs in, he will be redirected to a preconfigured page
- Configurable window for session timeout - sets the time for when Threat Response will log out due to user inactivity
In order to configure the user profile preferences, perform the following steps:
- Log in to Threat Response
- Click on the username at the top of the Threat Response menu bar
- Choose
Account preferences - Choose the
Default landing pagefrom the dropdown menu- Dashboard
- Incident list - My Incidents
- Incident list - My Team Queue
- Incident list - New Incidents
- Incident list - Open Incidents
- Incident list - Closed Incidents
- Incident list - Closed Incidents
- Threat Intel List - All Observables
- Threat Intel List - Today
- Choose the
Session Timeoutinterval- 15 minutes
- 30 minutes
- 1 hour
- 8 hours
- 1 day
Responses
Analysts respond to incidents to contain threats and the machines associated with those threats. They respond by adding IPs or hostnames to block lists or by placing users into security groups to be referenced in policies on other systems.
Adding host to a list
Adding hosts to a Threat Response list enables an administrator to place malicious IPs, hostnames, and domains onto a block list, or to simply add local IPs into a group that has more verbose network logging.
Examples:
- Adding Command-and-Control Hosts to a Block List on a Firewall
- Adding Suspicious Local IPs Into a Group That Has Increased Network Logging
- Adding Suspicious Local IPs Into a Block List That Restricts Access to a Sensitive Subnet
To add a Host to a Host list:
- Click on the
Respondlink in the Incident Toolbar to take action from any incident details page. - Click on the
Add to listlink(s) in the Hosts section of the Incident overview. - Click on the
Add to listlink(s) on the Incident > Hosts page. - Use Match Conditions to automatically place IPs and hostnames onto a list.
Adding URL to a list
Adding URLs to a URL list in Threat Response enables an administrator to map a URL list to their web content filter devices. Combined with automated response rules in Threat Response, an administrator can quickly block access to websites serving malware across their entire user base.
Examples:
- Blocking Access to Websites That Have Been Reported as Hosting Malware
To add a URL to a URL list:
- Click on the
Respondlink in the Incident Toolbar to take action from any incident details page. - Click on the
Add to listlink next to the URLs section on the Incident Overview page. - Navigate to
Hosts > URLsin the Incident view and click on Add to list. - Use Match Conditions to automatically place URLs into a Threat Response list.
Adding a user to a list
Users can be added to a Threat Response user list so that they can be mapped to a user group on a directory server. This allows the administrator to build access restriction policies in systems that reference these user groups.
Examples:
- Disallowing Accounts Suspected of Compromise from Establishing VPN Tunnels
- Disallowing Infected Users from Sending Emails Based on Group Membership
- Preventing Infected Users from Logging Into a Wireless Network Based on Group Membership
To add a User to a User list:
- Click on the Respond link in the Incident Toolbar to be able to take response action from any incident details page.
- Navigate to the Identity tab in the Incident view and click on Add to list.
- Use Match Conditions to automatically place users onto a Threat Response list.
Adding file to a list
File hashes can be added to a Threat Response list to itemize good or bad files reported across incidents. These lists can be referenced by external systems that utilize file hashes for application monitoring purposes.
To add a File to a File list:
- Click on the Respond link in the Incident Toolbar to be able to take response action from any incident details page.
- Navigate to the Alerts tab in the Incident view and click on the Add to list link next to a malicious file reported as part of a malware alert.
- Use Match Conditions to automatically place files onto a Threat Response list.
Quarantining Emails
Emails reported in security alerts can be moved to a quarantine folder by Threat Response. By automating the response action, you can minimize the potential for a user to open the message and/or attachments.
Note
This response type is currently supported by Exchange 2007 (and later versions), as well as Exchange Online. For more information regarding Exchange configuration and quarantine responses, please refer to the Exchange Integration Guide.
To quarantine a reported email manually, use one of the following options:
- Click on the Respond link in the Incident Toolbar and then select Move email to quarantine from the response type drop-down list.
- Navigate to the Alerts tab within an incident, select the delivered email alert from Proofpoint TAP, FireEye, or any other support email security solution and then click on the Quarantine Email link next to the message ID.
Match Conditions can also be used to automatically execute a quarantine action upon receipt of a security alert.
Host Isolation Using Carbon Black
Threat Response version 3.1 introduced support for Carbon Black host isolation. Analysts can choose the host and manually isolate host from network using Carbon Black EDR.
Please, refer to the following integration guide to get more details on integration configuration:
Threat Response - Integration With Carbon Black EDR
In order to manually isolate host, analysts need to perform the following actions:
Note
Analysts need to belong to the team that has sufficient permissions to take host isolation action.
- Log in to Threat Response
- Navigate to
Inident Listpage - Click on the incident ID of the incident that you want to take action on
- Click on the
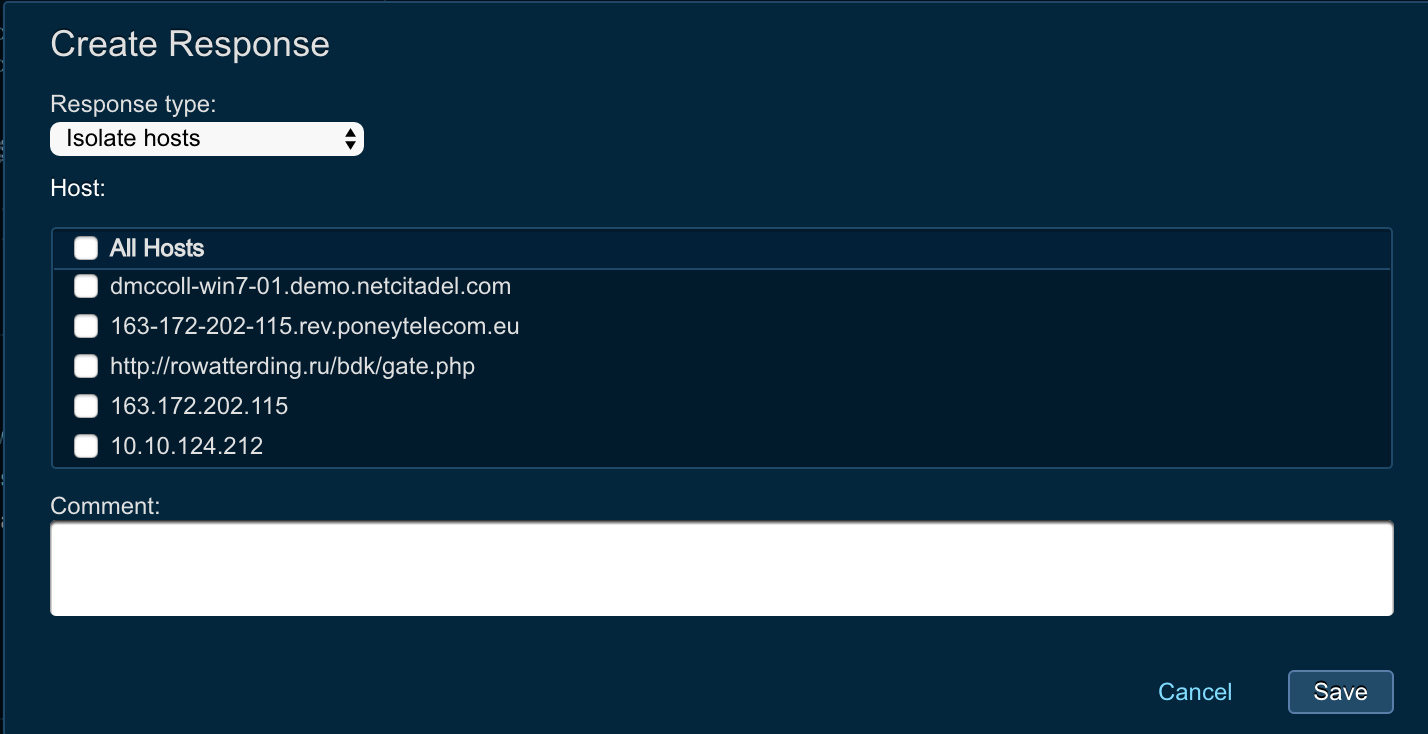
Respondlink at the top on the Incident Overview page - From the drop down menu choose
Isolate Hosts - Check the boxes for hosts that you want to isolate
- Provide comments
- Hit
Save
Match conditions
Match conditions enable a Threat Response administrator to create rules to take automatic action on alerts as they are received. Actions include adding hosts to an IP block list, adding URLs to a web content filter, or initiating a custom response to another purpose-built system on the network.
Adding a match condition
Use the Source Details panel to create and manage match conditions that define automatic actions to be taken on alerts.
Click on the add (+) button on the top right of the Match Conditions section to open a pop-up window where you can create these conditions and add them to an existing list or to a a newly created list.
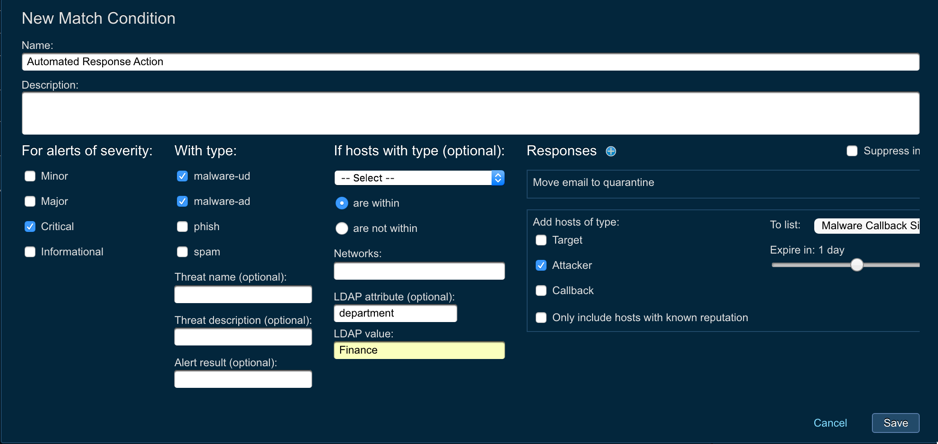
Match conditions are composed of two major parts: Match Criteria and Responses.
Setting match criteria
Select the event type and severity for which you want Threat Response to monitor. As alerts of this type are received, they will match a rule, and the appropriate actions will be taken. In addition to event type and severity, Threat Response also allows you to define the scope of the rule by specifying the IP or subnet to which it will apply, or to which users it will apply, based on their user attributes in LDAP.
Defining Responses
Once match criteria has been defined, responses can be added to the match condition to specify the actions that should be taken when an event is matched to the rule. Add a predefined or custom response by clicking on the add (+) button next to Responses in the Match Condition pop-up window.
Setting Expiration Time
Select a time from the expiration counter under Expires to change the frequency by which IP addresses added to a list will expire.
Suppressing Incident Creation
You can choose to discard an event once the appropriate actions have taken place. Proceed by ticking off the Suppress incident creation checkbox. This is useful if you want to define automated behavior for repetitive tasks but do not want these tasks to generate new incidents in Threat Response.
Saving Your Match Condition
When you are satisfied with your selections, click on Save to save the conditions, close the pop-up window and then add the list of match conditions for the selected source. The match conditions are added to the top of the list in the Sources window in the right pane.
Managing match conditions
Select a match condition and click on the Change link to modify the options relating to individual match conditions.

Disabling a Match Condition
Click on the Disable link to disable a selected match condition. Disabling a match condition tells Threat Response to ignore that match condition when a new event is received. Any actions present in the match condition will not be taken while it is disabled. Click on the Enable link to re-enable the match condition.
Deleting a Match Condition
Remove a match condition by ticking off the checkbox next to your selection and by clicking on the Remove (-) button.
Reporting
Threat Response provides a suite of prebuilt reports that enable an administrator to review statistical data regarding reported threats and activities in Threat Response.
Reports workspace
The Reports workspace is divided into the following elements:
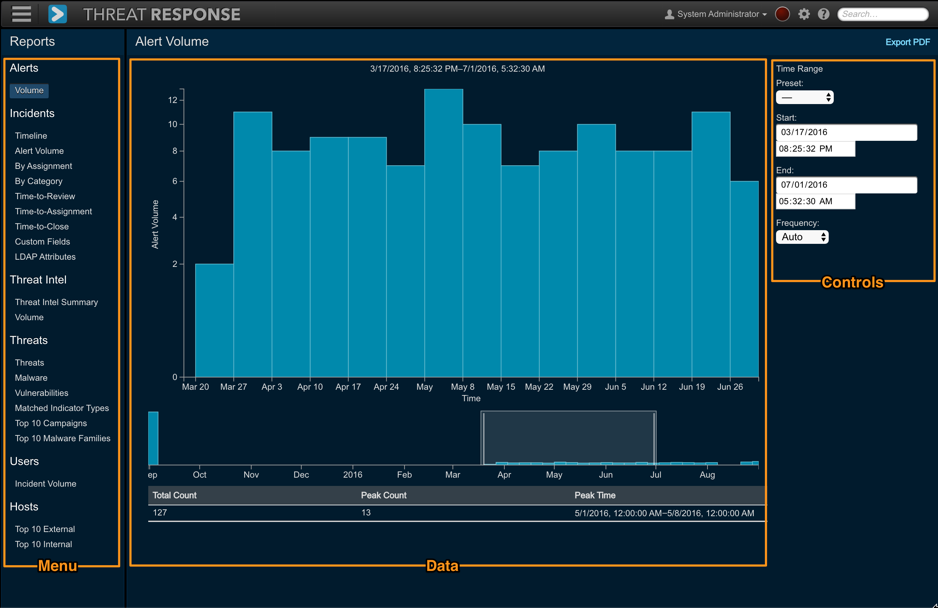
- Navigation Menu: The menu used to select from different report categories
- Data: This section includes:
- A graphical representation of the data contained in the report. Click and drag left or right to adjust the time range. Adjust the timescale by rolling your mouse wheel up to zoom in, and down to zoom out.
- A timeline, which allows you to quickly select a time range of interest. Click and drag to select a time range.
- A results table, which displays the results of the query in a text format.
- Controls: The filtering mechanism for the reported based on available options
Adjusting Time Range
To adjust the time range, use the timeline below the chart to select a period for review or use the Time Range controls on the right to specify a period for which you would like to report.
Predefined time ranges:
- 24 Hours
- 7 Days (default)
- 30 Days
- 90 Days
- 1 Year
- All Time
The chart is also interactive, thus allowing you to zoom in or out on the time window, as well as to slide the time window to the right or left.
Applying Filters
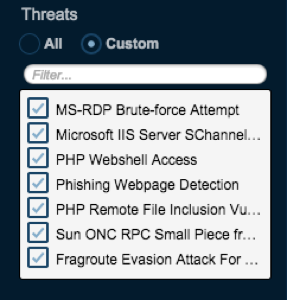
Some reports, such as the threat reports, will also display a filter box in the report controls. By default, the report displays all data, but this can be quite a large amount of data for very large time ranges. To use the filters, select Custom to activate the filter box. Once activated, select or deselect items to be displayed or hidden from the report.
Exporting Reports
Reports can be exported from Threat Response as a PDF document. To export a report from the system, click on the Export to PDF link in the upper right-hand corner of the reporting page. The report’s chart will be exported to a single page PDF document that can be saved to a user’s local system.
Report types
Threat Response reports are divided into categories based on their data. Each of these categories, and their associated reports, are described below:
Alerts
Alert reports show general information about alerts received by Threat Response.
- Alert Volume — The total number of alerts received by Threat Response over a given period of time
Incidents
Incident reports highlight various pieces of information about incidents, such as incident volume or the breakdown of incidents by certain attributes, as well as management-level reports designed to provide a view into the efficiency of incident handling.
- Incidents Timeline — The incidents created within a given time period. “Bubble” size indicates the overall threat score for an incident, while color indicates the incident’s current status (New, Open, Closed)
- Incidents Alert Volume - The report shows the incidents alert volume over time. Each incident is represented by a bar that shown the numer of alerts for that incident.
- Incident Age by Severity - In this report Threat Response groups incidents into buckets that represent time since creation (0-2d, 3-7d, 8-15d, 16-30d, 30 d+), and then within each bucket Threat Response displays incidents by severity.
- Incidents by Assignment — The incidents by assignees to summarize the overall analyst workload. Stacked bar colors indicate the current status of the incidents (New, Open, Closed).
- Incident by Team - The incident by team report summarizes the overall team workload. For each team Threat Response display how many new, open, and closed incidents are assigned.
- Incidents by Classification — A count of incidents broken down by incident type within a given time period. Incident types are based on the type of alerts they are receiving. The following types are displayed: Malware, Vulnerability, Network, Command and Control, Data Match, System Behavior, Policy Violation, and Authentication.
- Incident Time-to-Review — The time delta from the incident creation to when the incident was opened by an analyst for review. Each bar represents the average time across all the incidents within that time period.
- Incident Time-to-Assignment — The time delta from the incident creation to when a user was assigned to the incident. Each bar represents the average time across all the incidents within that time period.
- Incident Time-to-Close — The time delta from the incident creation to when the incident was closed. Each bar represents the average time across all the incidents within that time period.
- Incidents by Custom Field — A “donut” chart representing the incidents breakdown by the chosen incident field.
- Incidents by LDAP Attribute — A “donut” chart representing each value for the selected LDAP attribute. Attributes are derived from users associated with each incident, and different attributes can be selected from the drop-down menu on the right-hand side of the page.
Threat Intel
Threat Intel Reports show a breakdown of observables collected from external threat intelligence sources via STIX/TAXII or manually.
- Threat Intel Summary — The volume of observables that were collected from a configured threat intelligence sources, e.g. FS-ISAC and Hailataxii versus the count of observables that were linked to an incident
- Threat Intel Volume — The volume of observables collected over a period of time
Threats
Threat Reports show a breakdown of threats reported to Threat Response. This is useful for reviewing recurring malware within an organization or to review which vulnerabilities are most commonly seen.
- Top Threats — A breakdown of all the threats reported to Threat Response, ordered by number of occurrences
- Top Malware — The top malware names reported to Threat Response
- Top Vulnerabilities — The top vulnerability names reported to Threat Response
- Matched Indicator Types — The count of various types of observables/indicators (IP, host, URL, mutexes, etc.) that matched Campaigns or Forensic Reports across all incidents within a given time period
- Top 10 Campaigns — The top 10 Proofpoint email campaigns whose IOCs were linked to incidents or observables (threat intelligence) collected from external sources. This widget supports pivoting based on:
- Incidents: The top 10 campaigns based on the number of incidents that matched Proofpoint campaign IOCs
- Threat Intel: The top 10 campaigns based on the number of observables collected from external threat intelligence sources that matched Proofpoint campaign IOCs
- Top 10 Malware Families: The top 10 malware families whose IOCs were linked to incidents or observables (threat intelligence) collected from external sources. This widget supports pivoting based on:
- Incidents: The top 10 malware families based on the number of incidents that matched malware IOCs found in Proofpoint’s sandbox analysis
- Threat Intel: The top 10 malware families based on the number of observables collected from external threat intelligence sources that matched malware IOCs found in Proofpoint’s sandbox analysis
User Reporting
User reporting lists the internal users who have been reported the most across all incidents.
- Incident Volume — The internal users who have been reported across the most incidents
Host Reporting
Host reporting lists the internal or external hosts that have been reported the most across all incidents.
- Top Internal Hosts — The internal hosts that have been reported across the most incidents
- Top External Hosts — The external hosts that have been reported across the most incidents